PPC & SEO synergy part 3: ad copy testing & QS correlation with page speed
Part 3 includes two more synergy ideas, together with a downloadable checklist that you can start using internally. Before reading the post below, I recommend you check part one here and part two here.
The two synergy ideas covered in this post will be focused on the following subjects:
- PPC ad copy testing for SEO: we recommend taking learnings from your PPC ad copies and start testing your SEO metadata and on-page copy.
- A direct link between Quality Score and both PPC & SEO channels: we cover an experiment we conducted where we try to validate our hypothesis that QS has a direct impact on PPC but also SEO.
PPC ad copy testing for SEO
Remember when I was talking about using PPC to test keywords for SEO? Here we go again! This is where it gets interesting: because Google Ads provides a platform where we can easily test different ad copy (dear SEOs, I feel your pain as we can’t do this so easily for our organic listings), it makes sense to use it with SEO in mind as well.
The obvious destination for our tests is SEO metadata (title tags, meta descriptions, headings), but also on-page copy. Has a certain ad worked well for a particular keyword? Great, let me think about using it for SEO purposes.
Explore new page titles with CTR in mind
I strongly recommend exploring new page titles for instances when you want to optimise title tags with CTR in mind, especially for head terms where the SERPs display sites with the same/very similar title tags.
Trust me, this happens a lot (see the example below). Normally speaking, standard title tags often rely on individual high volume keywords, which make it hard to experiment with them as much as we would like to. Besides, character restrictions won’t allow us to make too many changes to our tags, which makes all SEOs quite lazy and prudent when it comes to optimising metadata.
We believe that testing is the way forward, rather than just assuming something will (or won’t) work. Thanks to SearchPilot, we have carried out several tests on page titles and collected several case studies.
Example: top 5 results for the query “Christmas gifts”
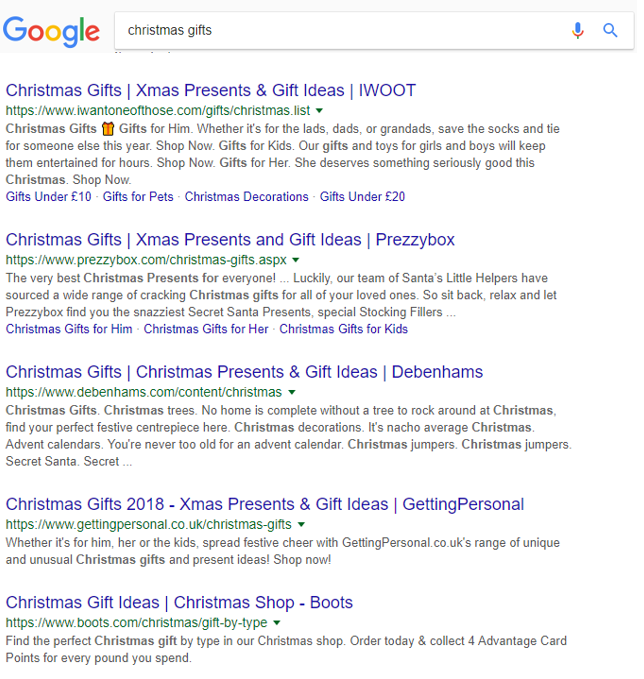
As a consumer, what would you do if all page titles look the same? Wouldn’t you want to see a website standing out with a catchier and cooler title rather than the examples above?
Test new meta descriptions
Another instance when I use data from PPC ads is when I need to (re)write meta descriptions, for two main reasons:
- Most meta descriptions nowadays are very dull so anything that can save me time and proves to be working, I am all in.
- They are more relatable to real ad copies and play a significant role from a CTR point of view.
Differently, from page titles, it is easier and safer to conduct tests on meta descriptions as they are not really a ranking factor anymore, so why not giving it a go?
What you need to decide next is which ad copies you are willing to use/take inspiration from: to be clearer, I will explain it with an example.
Imagine the following scenario:
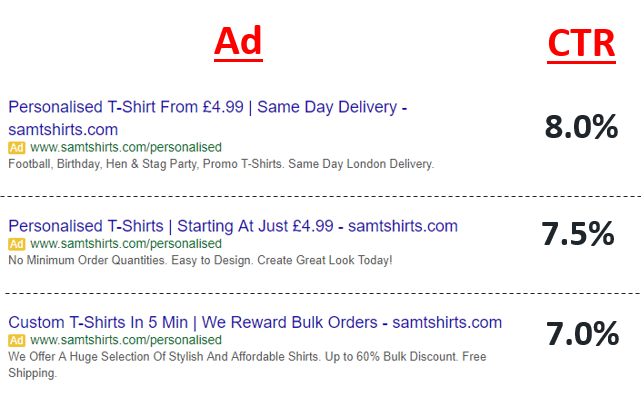
Let’s assume I have a website samtshirts.com that sells personalised t-shirts. I have a total of 3 ads running in rotation for the key term ‘personalised t-shirts’ – meanwhile, my SEO visibility is pretty good and I manage to rank on page one for this highly commercial term.
Now the question is: in case I want to test my ad copies in my metadata, which of the three ads do I pick for my SEO page?
- Option 1: I pick the strongest ad (with the highest CTR), and I will be in a situation where the messaging coming from my PPC and SEO is reasonably similar, if not the same. This will guarantee a consistent message and will reinforce my intent.
- Option 2: I pick the second strongest, and I will be in a situation where my messages coming from PPC and SEO are different and might be complementing each other/working together.
What should you do? Test the above and implement what works for you!
Test new copies on your transactional pages
I talked about this idea in detail in my guide to e-commerce category pages.
To sum up the core concept, e-commerce category pages are often the main destination of PPC ads. An underrated part of a transactional page is the character description which is usually placed at the top/bottom of the page: historically used for SEO purposes (extra text on the page), such copies are often neglected, as they tend to be reasonably badly written (keyword-stuffed) or moderately pointless in my opinion.
Why not avoid the hassle of coming up with a lousy description when you can use one that is actually useful? By retrieving data from your PPC Ads, you can choose copies with the best CTR and use them on the page.
The benefit will be two-fold:
- Your copy has been proven to be catchy/enticing rather than a boring one – instead of wasting precious time coming up with entire copies yourself, your PPC ads can quickly inform your content.
- Most e-commerce pages tend to be reasonably thin: they have little text on-page, which increases the likelihood of duplication in the eyes of Google among similar transactional pages. By providing an efficient description, we are adding context to the page which impacts the SEO potential of the page & influences the overall landing page experience (we covered this concept in-depth in post number 1) when such a page is used in PPC ads.
How to get started
If you do not know where to get started and which pages to test first, follow this process:
- Look at your Search Console for landing pages that don’t perform as well as they should: your key metric here is low CTR.
- Cross-reference your rankings with CTR industry standards (click here for my go-to page for this type of data) and determine which pages are underperforming from a CTR point of view. Bear in mind: in some instances, CTR is low due to ambiguity in the keyword, such as dual meaning to a term – these particular cases should be dealt with separately.
- Start from the URLs which organically appear on page one of the SERP as they are the most valuable – export the list and start experimenting.
- In 2-3 weeks (at least try and reach a good amount of impressions on GSC, unique for every keyword/industry) review your changes and make a call on what is best to do next: leave the new metadata in place, revert back or keep experimenting.
Quick recap: why is this worth it?
- By taking advantage of PPC’s platforms and data availability, we can provide more effective SEO metadata and text descriptions on the e-commerce pages that can help us improve our CTR and hit the bottom line.
- This approach will save you time, effort and is based on real data collected from Google Ads.
QS and Page speed go hand in hand
In post one of our series, we touched on Landing Page Experience and the five main elements that constitute this key component of Quality Score. In this section, I want to focus on the aspects of Landing Page Experience that relate to page speed.
According to Google, these are the two main points about page speed:
- Decrease your landing page loading time: make sure your landing page loads quickly once someone clicks on your ad, whether on a computer or mobile device.
- Make your site fast: see how your site scores on mobile speed, and get quick fixes to improve it.
All the above makes sense: you should have a fast site, so that when a user clicks on your ad, your page will load quickly and the overall user experience will benefit from it.
So if it is so obvious, why did we decide to spend time and resources to do an experiment on the direct link between page speed and quality score?
These are my main reasons:
- We like to test any hypothesis to prove whether it is true
- The lack of research on the subject made us want to test this even more
- Most importantly: showing a direct correlation between page speed and quality score will stress the importance of page speed itself, as it can show clear benefits from an SEO & PPC point of view. When talking to your clients or your devs, you can now tell them “let’s make page speed a priority: it will improve my SEO performance (Google confirmed it is now a ranking factor), it will improve the overall quality score, which ultimately impacts the spending and efficiency of our accounts”.
Methodology
Before we dive into the results of our test, let’s talk about our methods. See the list below to understand our rational and limitations:
- We conducted our tests on our Google Ads account rather than using a client’s account for two main reasons: direct control on changes to the pages from a dev point of view & intention to prove the validity of our test before suggesting the use of client resources for it.
- Our quality score for our account when conducting the test was low (overall average between 2.5 and 3) due to a mix of factors which are not important to cover now.
- We conducted two tests in total, taking learnings from the first one, which we applied to the second one (which is the one we will talk about in this post).
- The timeframe of our final (and second) test was just under a month.
- In order to monitor the average value of quality score throughout the test, we used a script which populated a Google sheet for us.
- In order to monitor page speed throughout the test, we used a Pingdom subscription to monitor the page speed continuously, while also regularly checking page speed insights, Lighthouse, GT Metrix, Webpagetest (manual checks).
- We did not make any change to our Google Ads account or any other changes at all to the page of interest during the testing time frame since they might have altered our findings.
Limitations
Our tests were not perfect: let’s clarify it from the start – but we could also argue: how many studies & research we see online are perfect?
We did our best to examine the correlation between all variables involved, but obvious limitations applied:
- We used a small budget compared to what a big PPC spender/account might use
- We ran the test targeting one page mainly as the Google Ads campaigns were built to promote one particular page
In all fairness, having a small budget made it harder to prove the validity of our test due to the fact our keywords did not collect data as fast as big budgets would allow. With a more significant spend, we surely would have had an easier time & data-turnaround.
However, having a small budget has one positive: the lower the traffic, the less likely that CTR or ad relevance factors would change in the tested timeframe; therefore the Landing Page Experience portion of the QS should have been highlighted.
Ultimately, most of you might be thinking about this question right now:
Can I trust this test or are you guys talking BS?
My humble response to the above is to be short and sweet: this test aims to provide validity for more and bigger tests, so we see it as the start of the conversation rather than the final answer.
Page speed changes
To identify what changes to make on the page of interest, we decided to use both Lighthouse and Page speed insights reports, which are Google products: at the end of the day, quality score is a Google metric itself.
We based our suggestions on both reports and compiled a list of the three main changes to apply on the page at different times:
- Reduce render-blocking resources
- Minify CSS and JS
- Optimise images on the page
After talking to our devs here at Brainlabs, we agreed on making the changes above, following a precise time frame that we used to coordinate efforts.
Without going into a page speed rabbit hole (this post is not about that), let’s move onto the results we came across.
Results
Find the table with all the results below:
| Changes | Day | Avg. QS | QS change % compared to day 0 | Page speed insights score (mobile) | Score change % compared to day 0 | Lighthouse score | Score change % compared to day 0 |
| No changes yet | 0 | 2.62 | 10 | 7 | |||
| First change: | 3 | 2.62 | – | 15 | 50.00% | 12 | 71.43% |
| 1 day after first change | 4 | 2.62 | – | 15 | 50.00% | 12 | 71.43% |
| 2 day after first change | 5 | 2.62 | – | 15 | 50.00% | 12 | 71.43% |
| 3 day after first change | 6 | 2.62 | – | 15 | 50.00% | 12 | 71.43% |
| 5 day after first change | 8 | 2.62 | – | 15 | 50.00% | 12 | 71.43% |
| Second change: | 9 | 2.62 | – | 15 | 50.00% | 12 | 71.43% |
| 1 day after second change | 10 | 2.66 | 1.55% | 20 | 100.00% | 12 | 71.43% |
| 2 day after second change | 11 | 2.71 | 3.23% | 20 | 100.00% | 12 | 71.43% |
| 3 day after second change | 12 | 2.74 | 4.50% | 25 | 150.00% | 13 | 85.71% |
| 10 day after second change | 19 | 2.74 | 4.50% | 25 | 150.00% | 13 | 85.71% |
| Third change: | 20 | 2.74 | 4.50% | 25 | 150.00% | 13 | 85.71% |
| 1 day after third change | 21 | 2.70 | 2.84% | 23 | 130.00% | 15 | 114.29% |
| 2 day after third change | 22 | 2.69 | 2.46% | 23 | 130.00% | 15 | 114.29% |
| 3 day after third change | 23 | 2.67 | 1.92% | 23 | 130.00% | 15 | 114.29% |
| 5 day after third change | 25 | 2.68 | 1.92% | 23 | 130.00% | 15 | 114.29% |
Result highlights:
- Avg Quality Score improved by almost 2% at the end of the test, but reached a peak of almost 5% improvement after the second change
- Page speed scores improved by 130% (Page speed insights) & 115% (Lighthouse) at the end of the test
- While all changes did have an impact on page speed scores, the first change did not have any effect on QS (render blocking resources)
- The second change to the page was the one that impacted QS the most (minification of CSS & JS)
- The third change to the page seemed to have lowered QS if compared to levels reached after the second change (image optimisation). The reasons behind this change could be attributed to other external factors related to our server or site that occurred while the test was run, so I would personally not focus too much on this finding.
Conclusion & Questions
The initial hypothesis was proven right: there is a direct correlation between page speed and quality score. It appears to be lower than what we initially expected, but due to the limitations of our test, we were happy with the results.
All changes recommended by Google seemed to have affected page speed scores, as expected, but not necessarily on quality score. There were instances when page speed scores went up, but the quality score stayed the same. Therefore, it seems that all changes aimed to improve page speed do not necessarily imply direct changes to levels of quality scores.
Some changes seemed to have impacted page speed and quality score the most: minifying CSS & JS was the driver of the largest change. Surprisingly, compressing images or adopting WebP formats (for another test we ran, which we did not cover in this post) did not seem to impact quality score.
Most importantly, I was reminded that landing page experience is a significant factor of quality score, but does not account for the entirety of it. So any changes we implement with landing page experience in mind, actually impacts only a portion of the total quality score – so to move the needle in terms of quality score, we need a serious level of page speed improvements, as one simple change might not do the job. As for the exact measure of what the landing page experience accounts for, further testing should help us determine its weight.
In case you had one of the following questions, we put together a list here:
Will you run another test on the subject to validate the results of this one?
We plan to keep running more of these tests to validate our hypothesis better – we are advocates of knowledge sharing at Brainlabs, so please get in touch if you decide to run a similar experiment.
What was the most surprising thing about the results, in your opinion?
The biggest surprise was the minimal changes to page speed scores and quality score provided by image improvements. More on this in question 4.
What change had the highest impact on quality score?
Our efforts to minify CSS & JS seemed to have had the highest impact compared to the other two changes.
What changes did you make to the images?
For our first test, we initially used the WebP format that Google has been advocating for a long time: surprisingly that did not seem to have had any direct impact on the speed of the page (very minimal to none changes detected).
For our second test, we just compressed the images, keeping the same format. Even this action did not provide as much improvement as we hoped for, which make us believe images do not seem the needle in terms of speed and quality score changes.
What changes did you make in terms of render blocking resources?
This involved auditing any javascript files that did not need to be executed immediately when loaded. These scripts would otherwise block the rendering of the page and loading of other resources. By adding an `async` attribute to these script tags, we can defer the execution of that script and allow the rendering of the page to continue immediately.
What changes did you make in terms of CSS and JS minification?
This involved auditing all the CSS and JS files and running them through a minifier to reduce file size. A minifier will retain the logic contained in the original file but remove any unnecessary characters.
Quick recap: why is this worth it?
- Showing a direct correlation between Page speed and QS will impact the way we see page speed as a whole: its direct impact on both SEO & PPC will help increase the priority and importance of page speed fixes.
Our series of SEO & PPC synergy ideas terminates here.
In case you have not done it yet, check part one and part two:
Finally, we have put together a checklist that hopefully can help you promote synergies between the channels. All synergy ideas have been pasted in the Google Sheet file, together with additional info and recommendations.