

TL;DR
Mentions and citations tell you whether your brand shows up in AI answers. They don’t tell you whether that visibility is consistent, valuable or built to last. We tested five proposed KPIs that go a layer deeper:
- Consensus Position: How consistently does your brand appear across AI platforms?
- Share of Recommendations: When you appear, does AI actually recommend you?
- Citation Half-Life: How long does the visibility you’ve earned stick around?
- Share of Narrative: Are AI platforms describing your brand the way you want to be known?
- Prompt Space Coverage: Are you tracking enough of real-world demand to trust the rest of your visibility data?
These aren’t settled industry standards. They’re a framework for moving AI search measurement beyond simply proving you show up, towards understanding what that visibility actually means and whether it holds.
For the first phase of AI search, marketers had a relatively simple question to answer: does our brand show up?
That made mentions and citations a logical place to start. Mentions tell you how often a brand appears in AI-generated answers. Citations tell you how often those answers link back to a source associated with the brand. Both are useful signals, and both have quickly become standard parts of AI visibility reporting.
But presence alone can hide a lot.
A brand might appear in dozens of answers without ever being the one an AI platform actually recommends. It might show up consistently while being described in ways that undermine years of positioning work. A piece of content might earn a citation one week and disappear the next. And even a strong visibility score means very little if the prompts being tracked barely resemble the questions real customers are asking.
That is the measurement challenge AI search is moving into now. 2025 was largely about proving you show up. 2026 is about proving that visibility means something, and that it holds.
To explore what that next layer of measurement could look like, we tested five proposed KPIs against 13 weeks of live tracking data for an anonymized B2B brand, covering 33 prompts across four AI platforms. These are not settled industry standards. They are ways of asking better questions of data many brands are already collecting, borrowing approaches from fields including statistics, bibliometrics, brand tracking and survey research.
Together, they move AI visibility measurement beyond are we present? towards where are we strong, are we being chosen, how are we being understood, does that visibility last, and are we measuring the right demand in the first place?
1. Consensus Position: how consistently do AI platforms choose your brand?
A mention score can tell you how often your brand appears across all the prompts and platforms you’re tracking. What it can struggle to show is how consistently that presence is distributed.
That is what Consensus Position is designed to capture.
Think of every AI platform as an independent judge. For each prompt, you ask how many of those judges point to your brand. If you’re tracking four platforms, a prompt can therefore land anywhere from zero-platform presence to four-platform consensus.
Instead of blending all of that into a single average, Consensus Position shows the distribution.
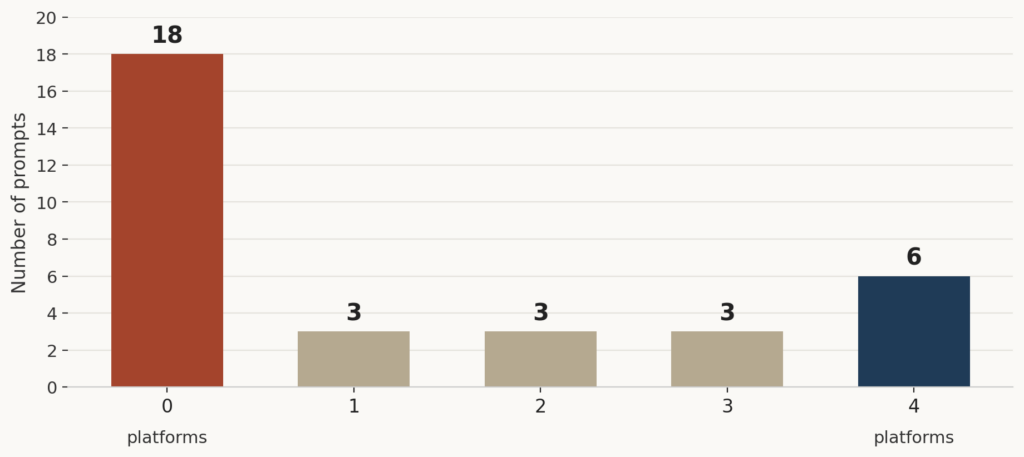
In the account we analyzed, 18 of 33 prompts showed the brand on none of the tracked platforms. Six showed it across all four, while another nine sat somewhere in the middle, appearing on one, two or three. A simple average of roughly 1.3 platforms per prompt would make that performance look fairly unremarkable. The distribution tells a much more useful story.
Those three groups require three different strategies.
The zero-platform prompts show where the brand is invisible across the entire tracked ecosystem and where new content or authority-building work may be needed. The four-platform prompts are positions worth defending. And the prompts sitting in the middle may be the most immediately actionable of all: the brand already has some presence, so closing the remaining gap could be easier than starting from zero.
The value of Consensus Position, then, isn’t another visibility score. It’s showing where visibility is absent, partial or broadly agreed upon, so those situations don’t disappear inside an average.
2. Share of Recommendations: are you being mentioned or actually chosen?
Once you know where your brand appears, the next question is more important:
What is the model actually doing with that presence?
There is a meaningful difference between an AI platform naming a brand as one option among many and explicitly recommending it as the answer.
Most mention metrics treat those two outcomes exactly the same.
Imagine asking an AI platform for the best analytics software. It gives you eight vendors, but singles one out as the strongest choice for your needs. Eight brands receive a mention. Only one receives the recommendation.
That distinction is what Share of Recommendations is designed to measure.
In the account we tested, there were 42 brand mentions across 33 tracked prompts, but only four met the recommendation threshold: the brand was presented as the answer, the lead choice or an explicit suggestion rather than simply appearing in a list. That produced a 12.1% Share of Recommendations and a 9.5% recommendation rate among mentions.
The second number is particularly useful because it tells you how often presence turns into advocacy.
A brand that appears in 80% of answers but is recommended in only 5% of them has a very different problem from one that appears in 20% and gets recommended 15% of the time. The first has visibility but struggles to persuade. The second may already be compelling when it appears, but needs broader coverage.
Mention counts alone can make those situations look deceptively similar.
That makes Share of Recommendations one of the closest things AI search currently has to a conversion signal. It identifies the point where the model moves from informing a user about the market to actively advising them what to choose.
There is judgement involved here. A recommendation needs a fixed definition, particularly when models use hedged language like “a strong option for teams that need X.” The important thing is consistency: define the bar once and apply it the same way over time, otherwise changes in the metric can reflect changes in classification rather than changes in model behavior.
3. Citation Half-Life: how long does your visibility last?
Being cited is valuable. But a citation that disappears next week and one that remains for months shouldn’t be treated as equivalent.
Citation Half-Life adds time to the equation.
For every URL that an AI platform cites, you track when it first appears and when it is last seen across repeated prompt runs. The metric then tells you the typical lifespan of the URLs that continue to be cited.
In our test account, the median half-life among URLs cited more than once was 28 days. But the more revealing finding was what happened before that calculation: 76% of cited URLs appeared for a single week and were never cited again.
That changes how you think about the value of AI visibility.
A content format that repeatedly earns long-lived citations can become a compounding asset. The work required to earn the citation happens once, while the visibility continues paying back over time. A format whose citations disappear almost immediately creates the opposite dynamic: visibility has to be continually re-earned.
The same logic applies to third-party sources. If citations from one review site repeatedly persist while citations from another aggregator disappear after a week, the first may be considerably more valuable even if both are driving the same number of citations today.
This is why Citation Half-Life starts to answer a question most AI visibility dashboards currently struggle with:
Where is our investment creating durable visibility, and where are we running on a treadmill?
The number should still be treated carefully. The 28-day figure in this analysis applies only to the minority of URLs that were cited more than once; across every URL in the dataset, the median would effectively be zero. Thirteen weeks is also too short a window to establish an industry benchmark. The value at this stage is proving that durability itself can be measured and compared over time.
4. Share of Narrative: what are AI platforms actually saying about you?
A brand can perform well on mentions, recommendations and citations and still have a problem. It can be visible for the wrong reasons.
Share of Narrative looks beyond whether a brand appears and measures how AI platforms characterize it: the attributes they associate with the brand, the use cases they assign to it and how closely that language matches the positioning the brand wants to own.
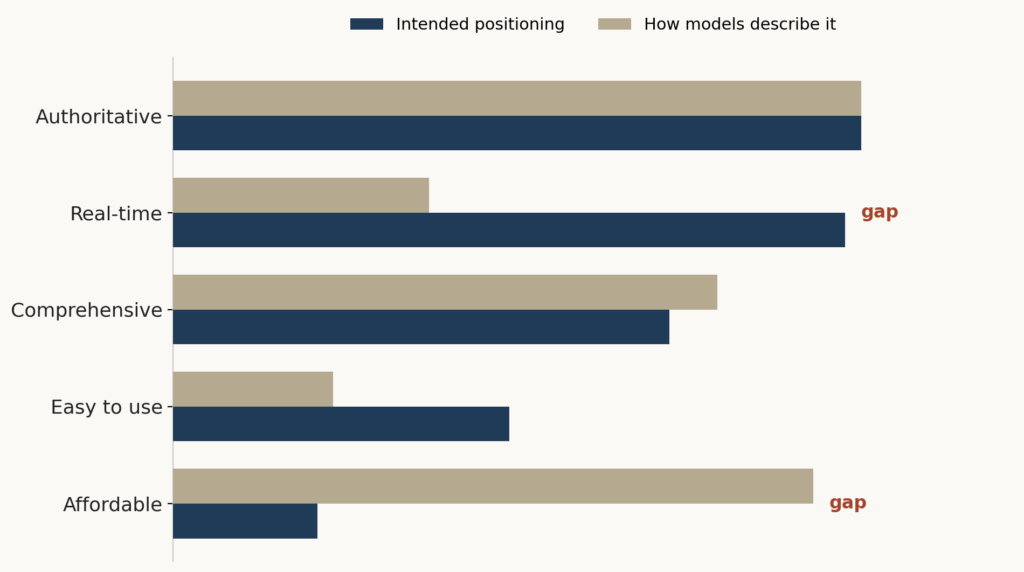
This matters because narrative problems rarely look like outright negative sentiment. Imagine a software company that has spent years positioning itself around real-time data. AI platforms mention it frequently and describe it positively, but consistently call it “comprehensive, though slower to update.” A conventional visibility dashboard might look healthy. From a brand perspective, the model has learned precisely the wrong thing.
Because this is the most interpretive metric in the framework, the method matters. We recommend three steps:
- Fix 5–8 positioning attributes with the brand upfront.
- Score every tracked response against those same attributes, using the same classifier each week.
- Track the gap between intended and observed positioning over time, focusing on the direction of movement rather than the absolute score.
The attributes should come from the brand itself, usually from an existing positioning or messaging framework. The goal is consistency, not pretending there is one objectively correct score.
What this tells you: if an important attribute repeatedly fails to appear, the evidence supporting that position may not be reaching the sources AI platforms rely on. If the narrative suddenly shifts on one platform but remains stable elsewhere, that can point towards a particular source, page or discussion that has started influencing the model differently.
This is also why Share of Narrative should be treated as a trend rather than a universal benchmark. Change the attribute list or classifier and you change the result. The useful signal is whether the gap between how the brand wants to be known and how AI describes it is widening or closing over time.
5. Prompt Space Coverage: are you measuring the questions people actually ask?
Every metric above depends on one assumption:
The prompts you’re tracking are representative of the demand you care about.
That assumption deserves far more scrutiny than it usually gets.
Traditional keyword research operated in a relatively observable search environment. Prompt behavior is much harder to define. People can ask effectively the same question dozens of different ways, add context, introduce named entities, combine several needs into one request or respond conversationally to what came before.
That means the denominator behind any AI visibility score is ultimately a prompt list somebody chose.
Prompt Space Coverage asks how well that list overlaps with the questions people appear to be asking in the real world.
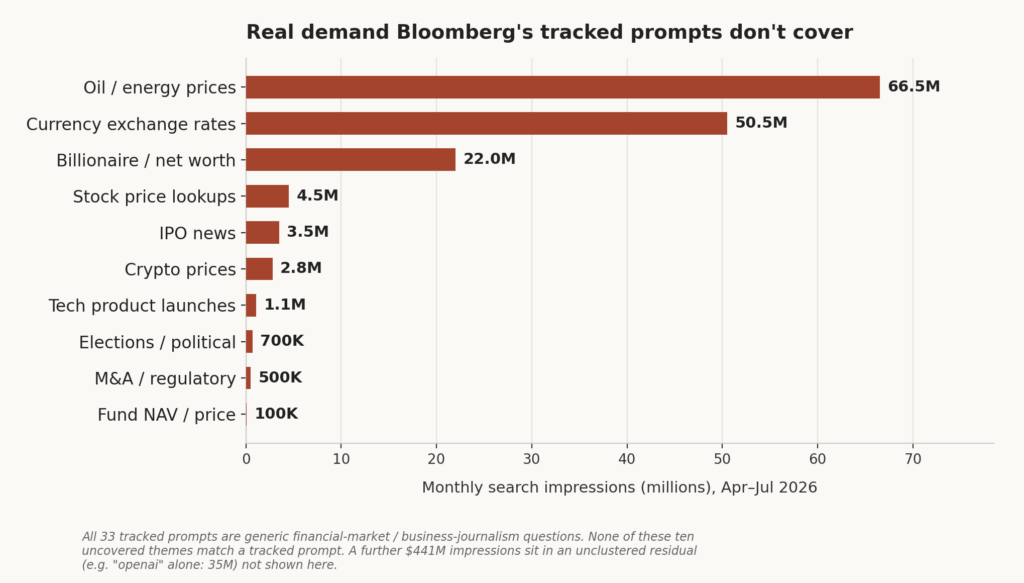
In the account behind this research, the 33 tracked prompts were predominantly generic, evergreen financial-market and business-journalism questions. When we compared that set with Search Console data from April to July 2026, we found roughly 690 million impressions across around 15,000 queries sitting in themes that weren’t represented by any of the tracked prompts.
Those gaps included 66.5 million impressions around oil and energy prices, 50.5 million around currency exchange rates and 22 million around billionaire and net-worth rankings, alongside meaningful demand around stock prices, IPO news, crypto, tech launches, elections and M&A.
The AI visibility program wasn’t necessarily performing badly against the prompts it tracked. The problem was that those prompts captured only one part of the demand landscape.
That is why Prompt Space Coverage is best thought of as the honesty check on every other metric.
A statement like “38% Share of Mentions” sounds precise. For example, if those prompts represent only 61% of the demand themes you’ve identified, “38% Share of Mentions at 61% prompt coverage” tells a much more honest story.
This won’t ever become a perfectly precise measure because the reference set itself is still a sample. Its job is to expose major blind spots rather than pretend the full prompt universe can be counted. The uncovered areas are arguably more useful than the percentage itself because they give teams an immediate list of questions they are neither tracking nor, potentially, answering.
One more signal worth watching: Source Concentration
There is one additional measure in the research that we wouldn’t treat as a sixth growth KPI, but it can provide useful context.
Source Concentration looks at how dependent a brand’s AI visibility is on a small number of cited domains. If most citations come through two websites, that visibility may be more fragile than a similar level of visibility supported by dozens of independent sources.
The idea borrows from the Herfindahl-Hirschman Index used to measure concentration in markets. Applied to AI search, it can show whether citation visibility is spread broadly or rests disproportionately on a handful of domains. In the account we tested, the median score was 407 (on a 0–10,000 scale), indicating fairly diverse sourcing.
The important caveat is that this isn’t necessarily something a brand can or should try to optimize down. Some categories naturally have a much smaller pool of authoritative sources than others. Its value is understanding what your visibility depends on, so you know where a changed page, locked thread or blocked crawler could create disproportionate risk.
The future of AI visibility isn’t one bigger score
Once you have five new metrics, the obvious temptation is to combine them into one master AI Visibility Score.
We think that would miss the point.
Each metric exists because it answers a different strategic question. Consensus Position shows where visibility is established or fragmented. Share of Recommendations tells you whether that visibility translates into advocacy. Citation Half-Life shows whether it persists. Share of Narrative shows what the brand is becoming known for. Prompt Space Coverage tells you whether the entire measurement framework is pointed at the right demand.
Compressing those questions into one number makes a dashboard simpler, but it can make the underlying problem harder to see.
Consensus Position demonstrates why. In our dataset, an average of roughly 1.3 platforms per prompt sounds like a single middling result. In reality, it contains three completely different situations: 18 prompts with no presence, six with full presence and nine with partial presence that may represent the clearest near-term opportunities. The average removes the very distinction that makes the data actionable.
There is also still a lot to prove. None of these metrics has yet been validated against long-term revenue performance, and some, particularly Share of Narrative, remain inherently interpretive. The point isn’t to pretend AI search measurement is more mature than it is. It is to build from methods whose underlying logic already has precedent elsewhere and test whether they give marketers better signals than mention and citation counts alone.
Because that is where AI visibility measurement needs to go next.
Knowing that your brand appears in an AI answer is useful. Knowing how consistently it appears, whether it gets recommended, what the model says about it, how long that visibility lasts and whether you’re measuring the right demand at all gives you something much closer to a strategy.
Mentions and citations proved you show up.
The next job is proving that it holds.