


Brainlabs analysed 1.35 million keywords across nine categories of UK search. The findings are unambiguous. Head terms are in structural decline in seven of nine categories. Longtail is growing. AI Overviews are concentrating exactly where the volume is heading. For brands that depend on organic search, the window to adapt is narrowing.

The study that prompted this research — and the two questions it left unanswered
In August 2025, Semrush published a study that made headlines across the SEO industry. Analysing 260 billion rows of clickstream data, they tracked how users’ Google behaviour changed after their first interaction with ChatGPT.
Their conclusion: ChatGPT is not replacing Google — it’s expanding search. Users who adopted ChatGPT showed no statistically significant decline in daily Google sessions. If anything, overall search activity ticked up slightly.
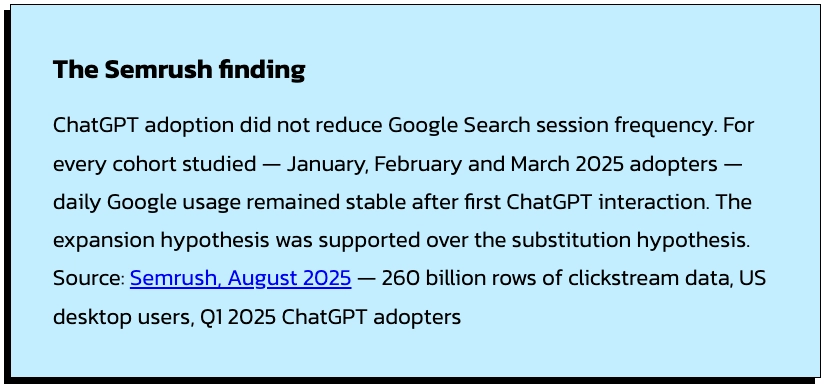
That finding could be interpreted as reassuring. I’d argue it shouldn’t be. The Semrush study measured whether people still use Google. It did not measure what they’re searching for when they get there, or what Google is showing them when they do. Those are different questions — and they’re the questions that matter most to brands trying to understand their organic visibility and paid search strategy over the next two years.
Google itself has stated publicly that average query length is increasing. Users are asking longer, more conversational questions, a pattern that predates AI Overviews but has accelerated sharply since. And our clients are seeing it directly: head term traffic softening, longtail queries growing, and AI Overviews appearing in places that go well beyond the purely informational queries where most people assume they sit.
So we pulled 1.35 million keywords across nine UK categories from Ahrefs and ran the analysis ourselves. Two hypotheses drove the work.
1. AI adoption is reshaping query composition inside Google — not just overall volume
People may still use Google at the same frequency, but what they search for is changing. AI tools are training users to ask longer, more specific questions. Head terms — the short, high-volume queries that have historically driven the most value — should be declining. Longtail and potentially branded queries should be growing. The Semrush study doesn’t address this. Ours does.
Verdict below: largely confirmed in 7 of 9 categories
2. AI Overviews are appearing on commercial queries, not just informational ones
The conventional wisdom is that Google deploys AIOs on informational queries — how-to, what-is, research-type searches — and keeps commercial SERPs clean to protect ad revenue. Our hypothesis is that this is only partially true, and that AIOs are already appearing across a broader keyword set including mid-funnel commercial queries. If correct, the click-suppression risk is more significant than most brands have planned for.
Verdict below: confirmed — AIO rate on longtail is 2–3× head terms across all categories
A note on methodology. Our analysis measures search volume trends at keyword level using Ahrefs data — a different lens to Semrush’s session-frequency approach. The two studies are complementary, not contradictory. Semrush answers: are people still using Google? We answer: what are they searching for when they do, and what are they seeing when they get there? Both questions matter. The second one has more direct implications for organic and paid strategy.
AIO coverage ranges from 6.9% to 43.9% — and the gap is not random
Google is deploying AI Overviews very differently across sectors. The variation reflects deliberate intent classification, not inconsistency in the algorithm.
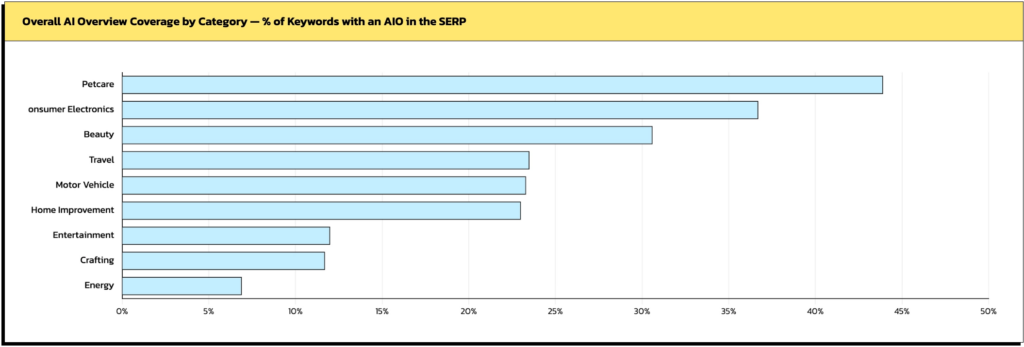
Petcare sits at the top because the category is saturated with informational queries. “What can dogs eat”, “is chocolate toxic to cats”, “how often should I worm my rabbit” — these are questions Google is confident AI can answer well, and answer accurately. Petcare rewards an AI-first content approach.
Energy sits at the bottom for the opposite reason. Most energy queries are navigational or commercially specific. “British Gas contact number”, “cheapest electricity provider”, “OVO Energy tariffs 2026” — Google recognises the liability of generating AI answers for queries where being wrong costs someone real money, and holds back accordingly.
Consumer electronics (36.7%) and beauty (30.6%) sit in the middle-upper range, both driven by strong research and comparison behaviour.
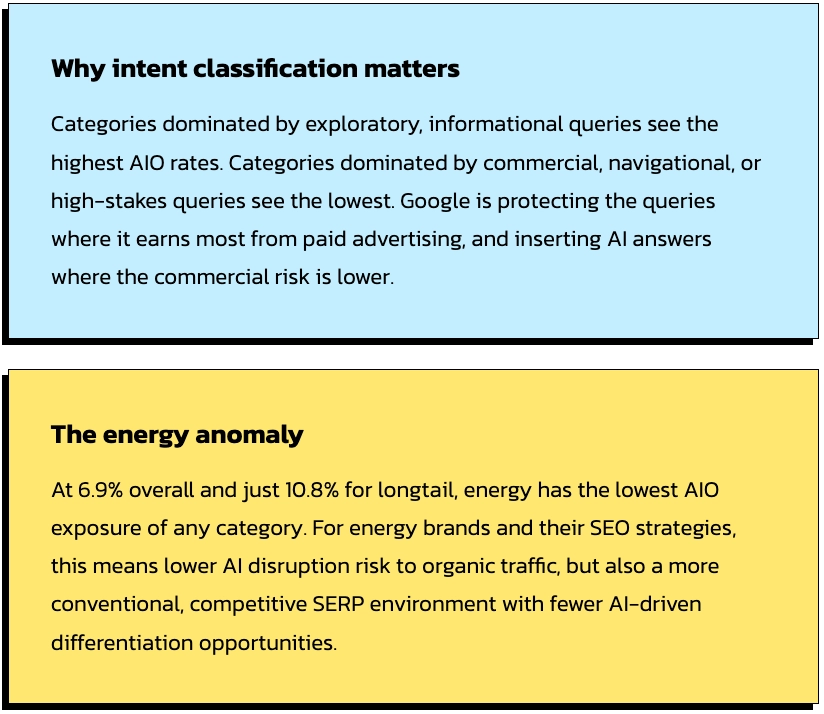
Travel (23.5%) and motor vehicles (23.3%) are almost identical despite having quite different demand profiles, which suggests a shared dynamic around commercial intent suppressing AIO deployment. Entertainment (12.0%) and crafting (11.7%) share a low AIO rate despite being informational categories — a finding worth interrogating, and one we return to below.
Longtail queries attract AI Overviews at nearly twice the rate of head terms — in every category
Across all nine categories without exception, the volume-weighted AIO rate for longtail queries (4+ words) consistently outpaces head and mid-length terms (1–3 words). In several categories the gap is dramatic. See below for an explanation of volume-weighted and methodology.
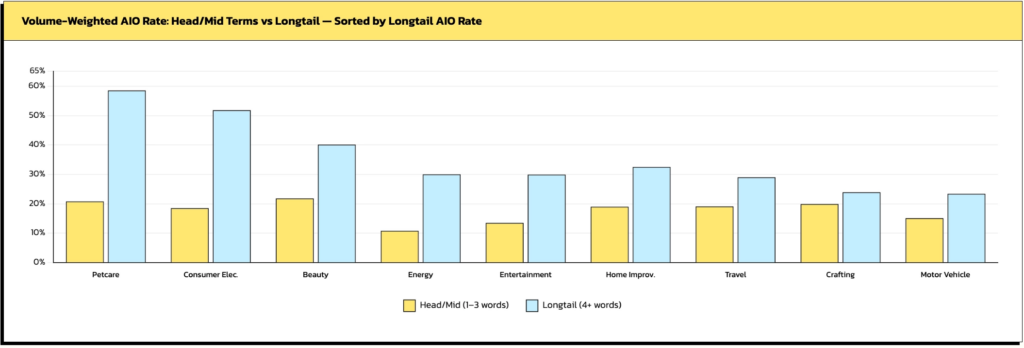
Petcare shows the widest gap: 20.8% for head terms against 58.5% for longtail. Consumer electronics is close behind at 18.5% versus 51.8%. The pattern tells a consistent story — Google sees longtail queries as the territory where AI-generated answers add the most value to users, and head terms as the territory where it proceeds with more caution, more often deferring to traditional ranked results.
Motor vehicles is the one genuine exception. The gap between head and longtail AIO rates is the smallest of any category (15.1% vs 23.4%), and the longtail premium barely exists. Car buying is a high-commercial-intent journey across almost all query types, and Google treats nearly all of it as too consequential for AI-generated shortcuts.
For brands in categories like petcare and consumer electronics, longtail optimisation is no longer just a traffic play. Being cited in an AI Overview for high-intent longtail queries is now a meaningful visibility objective in its own right, distinct from and complementary to traditional ranking.
“In petcare, longtail has nearly three times the AIO rate of head terms. That gap defines where AI disruption is concentrated — and where the content opportunity is sharpest.”
Head terms are losing search volume in seven of nine categories
The year-on-year trend for head and mid-length terms (1–3 words) tells a consistent story of structural decline, with entertainment and home improvement leading the fall and only consumer electronics showing meaningful growth.
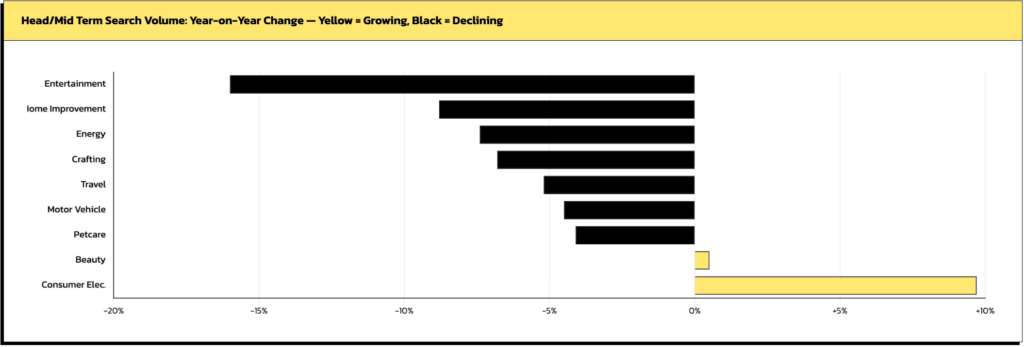
Entertainment’s -16% YoY decline is the sharpest in the dataset. It also happens to be the category where AI tools are the most credible substitute for Google. If you want to know what to watch tonight, ChatGPT, Perplexity or a streaming platform’s own recommendation engine can answer that without a SERP. The query is not migrating within Google — in many cases it is leaving the platform altogether.
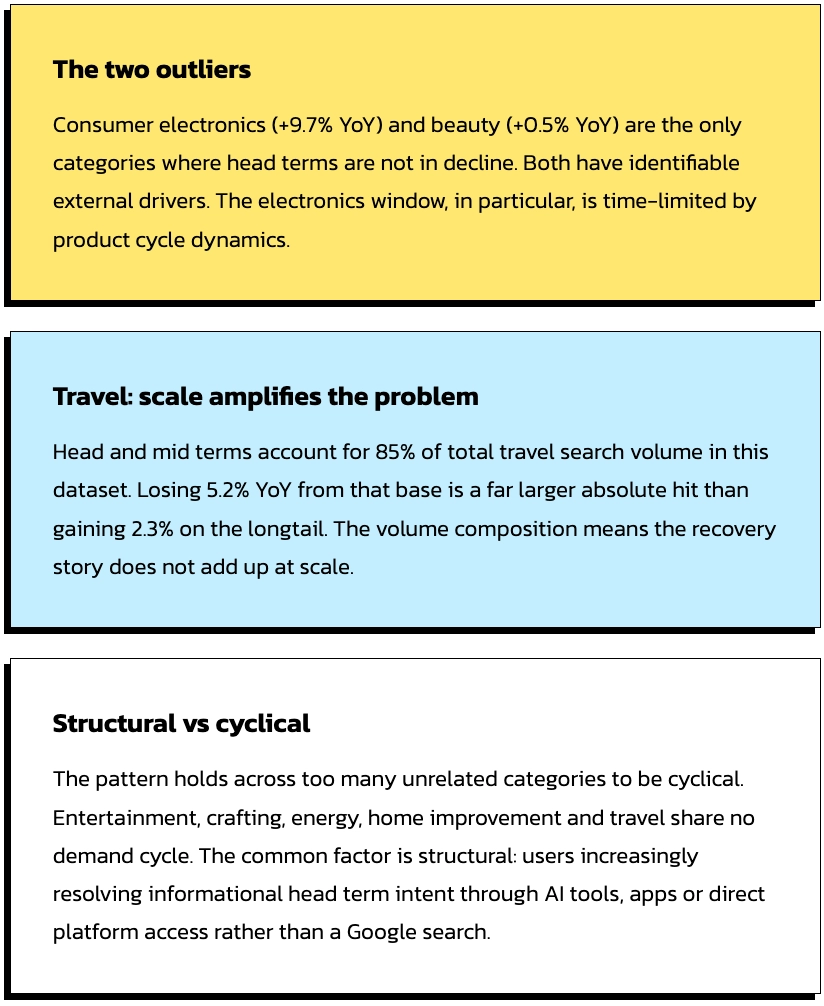
Home improvement (-8.8%), energy (-7.4%) and crafting (-6.8%) are all in meaningful decline. Travel (-5.2%) is the most alarming in absolute terms: with 165 million head term searches in the dataset, a 5.2% decline represents tens of millions of lost impressions annually, and 69.6% of individual keywords are already declining.
Consumer electronics (+9.7%) and beauty (+0.5%) are the outliers. Electronics is driven by the AI device supercycle — new product launches, spec comparisons and upgrade queries are generating genuine head term volume growth. Beauty reflects the continued strength of social-media-driven discovery, with trend-led search terms pulling up category-level head queries. Neither should be assumed permanent: the consumer electronics forecast already shows signs of deceleration at -4.7% projected for the coming twelve months.
As head terms fall, longtail is mostly compensating — but not always
Placing head and longtail YoY trends side by side reveals the scale of divergence. In most categories, the gap is significant. In only two categories are both longtail and head term volumes moving in a positive direction (Beauty and Consumer Electronics). And one (Motor Vehicles) where both are declining.
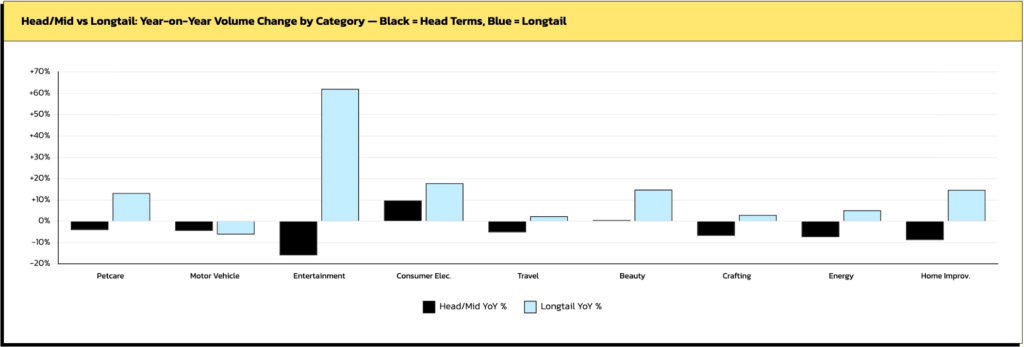
Entertainment shows the most dramatic divergence: head terms falling at -16% while longtail grows at +62.1% YoY. The scale of that longtail surge reflects a genuine structural shift in how entertainment queries are being formed. Users who once searched two-word terms like “Netflix shows” or “best films” are now asking longer, more specific questions: “what should I watch on Netflix if I liked Severance”, “best British crime drama 2026”, “feel-good films to watch on a Sunday”. Google is answering many of those with AI. The volume of such queries is growing fast.
Home improvement (+14.7% longtail, -8.8% head) and petcare (+13.2% longtail, -4.1% head) show a similar dynamic at smaller scale. The head term decline is real, but the longtail growth provides meaningful partial compensation in total volume terms, and the longtail queries carry higher AIO exposure, which changes the visibility calculus.
Motor vehicles breaks the pattern entirely. Both head and longtail are declining, suggesting the migration is away from Google altogether, towards OEM apps, dealer configurators and platform-specific automotive search tools. There is no longtail recovery to point to here. It is the most structurally challenged category in the dataset.

All nine categories — complete figures
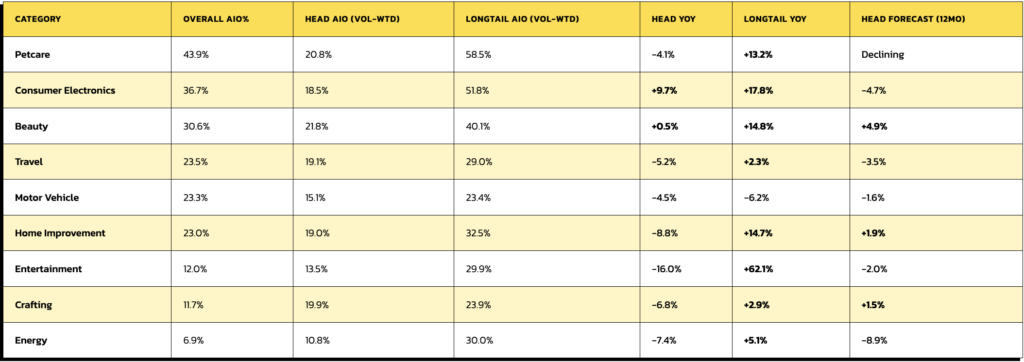
Methodology: Analysis based on 1.35 million Ahrefs keyword exports across nine UK categories, captured May 2026. Historical search volume data covers May 2024 to April 2026 (24 months). Forecast data covers May 2026 to May 2027. AIO presence identified via SERP Features column. Volume-weighted AIO rates calculated by weighting each keyword’s AIO flag against its monthly search volume. Head/mid terms defined as 1–3 words. Longtail defined as 4+ words. YoY trend calculated by comparing average monthly search volume, Year 1 (May 2024–April 2025) vs Year 2 (May 2025–April 2026).
Ranking is not enough. Three objectives now exist where one used to.
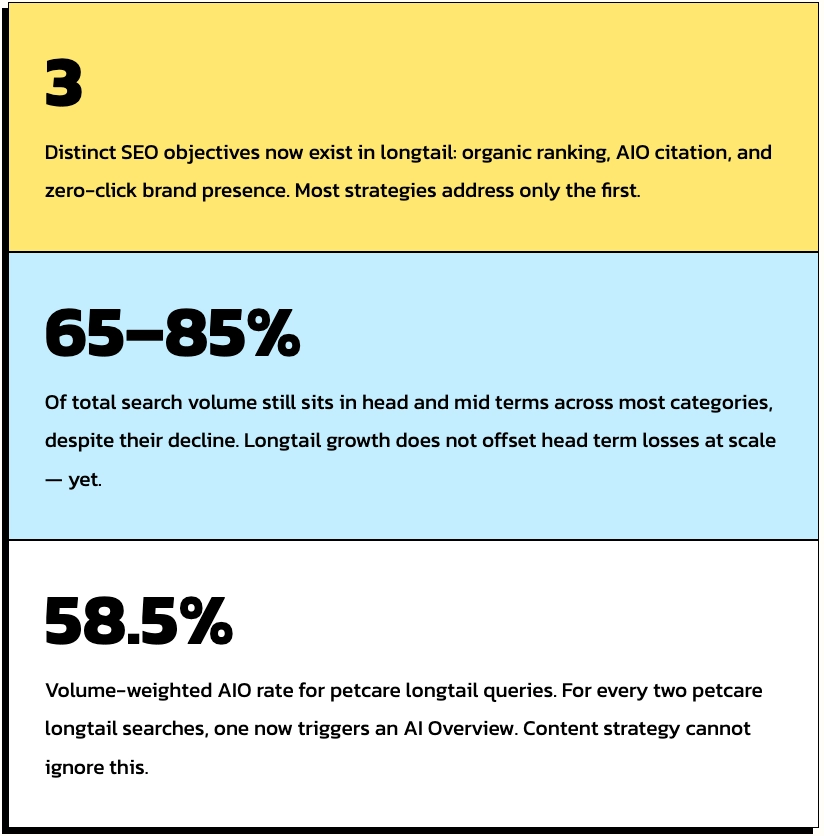
The longtail shift is real, and it demands a different strategic response than simply producing more content. The problem is that longtail is now the highest-exposure zone for AI Overviews. Across the nine categories, volume-weighted longtail AIO rates range from 23.4% to 58.5%. Being ranked position one for a longtail query no longer guarantees meaningful traffic if an AIO sits above you and resolves the intent without a click.
Optimising for AIO citation is now a parallel objective to ranking. That requires authoritative, well-structured content with clear, verifiable claims — not the broad, hedged, “comprehensive guide to X” articles that tend to perform well in traditional organic rankings. Google cites sources it trusts. Trust here means specificity, demonstrable expertise, and factual precision on the exact question being asked. Most brands’ content libraries are not built for this.
A third objective also exists in high-AIO categories: zero-click brand presence. When an AIO cites your brand as a source, you gain credibility and awareness even if the user never clicks through to your site. Measuring that exposure requires different frameworks to traditional organic traffic reporting. Most analytics setups are not capturing it.
The volume composition of most categories means head term decline hits harder than the percentages suggest. Head and mid-length terms still account for 65–85% of total search volume across most sectors. Travel’s 165 million head term searches versus 28 million longtail is the extreme example of a pattern that appears throughout the data. Losing 5–17% of head term volume is a larger absolute hit than gaining 15–62% on a smaller longtail base, in every category except entertainment.
“Most brands are optimising for a SERP that is gradually becoming less relevant to the queries where they most need to be visible. The longtail AIO rate is not a future problem — it is a present one.”
The two growing categories warrant a different approach. Consumer electronics and beauty are both currently in positive volume territory across head and longtail tiers. For brands in those sectors, more aggressive content investment is justified right now — the demand is there in a way it is not in entertainment, crafting or energy. That window may not last. The consumer electronics forecast already shows deceleration, and beauty’s head term growth is modest enough that one poor product cycle or trend reversal could turn it negative.
Declining head term volume has serious implications for Google’s ad revenue model
Google’s advertising business is disproportionately dependent on high-volume head term auctions. A travel brand, energy supplier or entertainment platform bidding on a two-word category term pays five to fifteen times the CPC of a four-word longtail query. Head terms drive auction depth. Auction depth drives CPC inflation. CPC inflation drives Google’s revenue per search. The mathematics of this dependency are not complicated.
If head term volume is falling 5–16% annually in several major categories, the auction economics deteriorate. There are fewer impressions to bid on. Fewer advertisers competing for the same impression pushes CPCs down, even if individual advertiser budgets hold flat. The categories where this risk is sharpest are entertainment (-16% YoY), energy (-7.4% with a further -8.9% forecast), home improvement (-8.8%) and crafting (-6.8%). Travel is the most concerning in absolute terms — the volume base is the largest in this dataset, and 69.6% of individual keywords are already declining.
“Google is deploying AI Overviews heavily on longtail queries and being conservative on commercially sensitive head terms. That pattern looks like deliberate revenue protection, not algorithmic coincidence.”
Longtail growth partially compensates. More longtail queries means more ad impressions, and those impressions often carry genuine commercial intent. But the revenue per click is materially lower, inventory is more fragmented, and match type complexity increases. Google would need substantially more longtail volume growth to offset head term revenue decline at scale. The current data does not show that happening at the required rate, outside consumer electronics and entertainment.
The more serious long-term risk for Google is not that AI Overviews directly cannibalise ad revenue on existing searches — it is that users who previously arrived at Google for informational head term queries are now going to ChatGPT, Gemini or other AI tools, and never reaching a SERP at all. That missing query does not migrate within Google. It simply does not appear in the data. Entertainment and crafting are strong candidates for this kind of silent attrition: knowledge and inspiration categories where conversational AI is a genuinely credible substitute for a Google search.
For paid search advertisers, the short-term implication is that head term CPCs in declining-volume categories may rise before they fall, as constrained supply meets similar demand pressure. After that, the dynamics depend on whether advertisers follow the volume migration into longtail or maintain head term budget allocations for brand visibility reasons. Most large advertisers will do both, which slows the adjustment. But the adjustment is happening, and the categories above suggest its scale.

How the data was gathered and analysed
Data source. All keyword data was exported from Ahrefs, one of the leading SEO data platforms. Ahrefs crawls the web continuously and collects live SERP data at scale, including which SERP features appear for any given keyword at any given time. AI Overview presence is tracked as a SERP feature within Ahrefs’ keyword data.
Dataset size and scope. The analysis covers 1.35 million keywords across nine UK consumer categories: petcare, motor vehicle, entertainment, consumer electronics, travel, beauty, crafting, energy, and home improvement. Each category dataset contains up to 150,000 keywords. All keywords are UK (gb) search queries captured in May 2026.
AIO identification. A keyword was classified as having an AI Overview if “AI Overview” appeared in the SERP Features column of the Ahrefs export. Volume-weighted AIO rates were calculated by weighting each keyword’s AIO flag against its monthly search volume, giving a more representative picture than a simple count of keywords.
A note on volume-weighting and why we use it: If we take a category e.g. Petcare, we have 150,000 keywords per category, but “dog food” gets 500,000 searches a month and “labrador puppy grain-free wet food pouches” gets 50. If we just counted how many keywords have an AIO, those two keywords would count equally — but “dog food” is 10,000× more relevant to what users actually experience.
So instead, we ask: of all the search volume in this category, what proportion of it is exposed to an AI Overview? That’s the volume-weighted rate.
So for head terms in Petcare, it looks like this:
- Sum up the search volume for every head keyword where AIO = yes → call that A
- Sum up the search volume for every head keyword → call that B
- Head AIO % = A ÷ B = 20.8%
If we’d just done count-based (keywords with AIO ÷ total keywords), we’d get a different number — and it would be skewed by thousands of niche long-tail head terms with tiny volumes.
The one place we did use count-based is the Overall AIO % column — because there we wanted to answer a slightly different question: “what share of keywords in this space even have an AIO at all?” That’s a content coverage question, not a traffic exposure question, so count-based is actually the right tool for it.
Search volume trends. Ahrefs provides a monthly search volume time series for each keyword. The historical series covers May 2024 to April 2026 (24 data points). The forecast series covers May 2026 to May 2027 (13 data points), generated using Ahrefs’ own forecasting model. Year-on-year trends were calculated by comparing the average monthly volume across Year 1 (May 2024–April 2025) against Year 2 (May 2025–April 2026). Keywords with incomplete series were excluded from trend calculations.
Keyword classification. Keywords were classified by word count: 1–3 words as head/mid terms, 4 or more words as longtail. This is a standard industry classification and aligns with how query intent typically shifts as length increases. All volume-weighted figures use the Ahrefs-reported monthly search volume as the weighting factor.
Limitations. AIO presence is a point-in-time snapshot — Google’s AI Overview deployment changes frequently. Ahrefs’ SERP crawls do not capture every query at every moment, so rates reflect a strong sample rather than a census. Forecast data is modelled and should be treated as directional rather than definitive.
Want to know where your category stands?
Brainlabs runs this analysis against specific client keyword sets as part of our SEO and Paid Search strategy work. If your sector is not in this dataset, or you want a deeper cut of your own data, talk to the SEO team.