7 easy Google Analytics reports to improve conversions
How to level up your basic GA reports and diminish wasted spend
Before we can ascertain why certain things are (or, more poignantly, aren’t) happening on a website, we have to be able to interpret what is happening – cue Google Analytics (GA). GA is, without a doubt, the digital marketer’s go-to source for unmining and prioritising testing opportunities on any website. But how can we unleash the full potential of the analytics platform to look beyond the basic insights and take testing to the next level, maximising conversion rate (CvR) and truly minimising wasted spend?
This blog post will take a quick look at some of the most insightful GA reports for CRO, giving you tips on how to make the insights go further on some of them, and exploring some lesser-known reports that will help you maximise your website’s converting potential even further.
Top 7 most insightful GA reports for conversion rate optimisation:
1. Device Breakdown: Audience → Mobile → Overview


Knowing which device to focus your testing efforts on first is invaluable and saves a lot of time if you know where the most conversions are coming from. In this example, we can clearly see that mobile receives the majority (64%) of traffic, yet has the lowest conversion rate of only 0.67% and should therefore get our attention first.
Take this insight further:
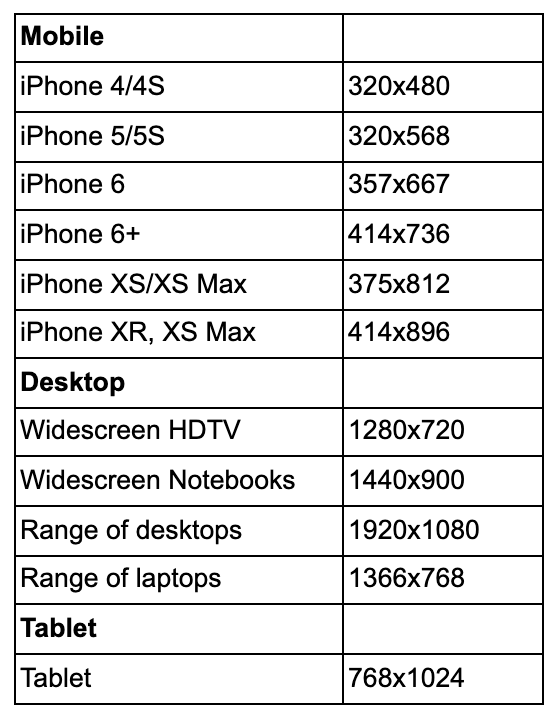
By clicking on ‘devices’ (just under ‘overview), you can also get a breakdown of the exact models that convert the most, and you can prioritise developing your first designs specific to those specs too. Use the below table to decipher exactly what device each spec refers to:
2. Site Speed: Behaviour → Site Speed → Page Timings → Explorer & Map Overlay Tabs → Site Usage Subtab → Average Page Load Time
User Experience without optimising site speed is like pimping out a car with a dodgy engine – no matter how good it looks, you’ll have a tricky time getting to your destination, and cause a lot of frustration along the way, if it runs slowly, or breaks down at any point in your journey.
GA can help you pinpoint slow load times, and align these to performance and engagement rates so that you can see where slow times are causing customers to drop out of the journey.
To view the page load times, follow the steps above. Once here, you can view the information in 3 different modes by clicking on the different toggle buttons in the top right corner; data, comparison, or pivot. Each display will give you different insights into metrics about the pages, including a comparison to the site average so you can see which pages are the slowest and need to be prioritised first – this is particularly important if checkout pages have slow load times, as you don’t want to lose the high-intent customers who are oh-so-close from converting.
Take this insight further:
Another handy feature of Google Analytics is that it allows you to build a custom page load time report by browser and browser type. To do this, follow the steps above and select ‘custom reports’, ‘flat table’ and choose the dimensions that you would like to see. This is another speedy way to see which pages you need to optimise first.

In addition to this, there are many tools that can help you analyse page speed, a couple of personal favourites being Google PageSpeed Insights and Lighthouse. Google PageSpeed Insights allows you to simply enter the URL and watch the tool build out an array of custom reports for you, including how you rank next to your competitors.
This will also give you a list of suggested actions to improve site speed, and prioritise them in order of most to least effective, such as in the below example:

Lighthouse is a similar tool that works particularly well alongside SEO, and can be added as a Chrome extension.
3. Behaviour Flow: Behaviour → Behaviour Flow

The behaviour flow report is a visual representation of the user journey by site page, and where in the user journey users are dropping off between events. This report is an easy way to identify which content is the most engaging and which content needs to be worked on to further drive users through the funnel.
Common issues to look for in areas of high drop off include site bugs, and more broadly, content not aligning with the user’s expectations from the previous stage(s) in the user journey.
4. Landing Page Performance: Behaviour → Site Content → Landing Pages
This report is key for understanding the first impression your audience has with your site. Particularly if you’re paying to drive people there. At first glance, you can see which landing pages need their CvR to be worked on, and allows you to easily prioritise the pages by their potential.
You can do this simply by looking at CvR by landing page, or you can look at secondary metrics to analyse behaviour on these pages, such as % exit and bounce rate.

Take this insight further:
While you can immediately see data on all landing pages of your website, by clicking on the ‘advanced’ button, you can group and arrange landing pages into different reports using custom categories and parameters. For example, if you want to see an average bounce rate of every landing page that forms a menu, you can filter by ‘URL contains ‘menu’’, and get easily digestible numbers from there.
5. Site search report: Behaviour → Site Search → Usage

Research reveals that users who use site search are twice as more likely to convert than those that don’t. The extent to which this applies to your specific site varies, but in general, those who search are higher-intent as they know specifically what product they are after, and the results will more closely match what they want.
The extent to which this applies to your specific site varies, but you can follow the steps above to see the difference between searchers and non-searchers to decide if the experimentation here is worthwhile.
Take this insight further:
Create a conversion report by site search status using this GA tool, where you can add custom segmentation to analyse other behavioural aspects of site searchers vs. non-searcher.
6. Conversion by acquisition score: Acquisition → All Traffic → Source/medium
Imagine this: you’ve just clicked on an ad for Nike trainers, and you land on a landing page for baby strollers. No matter how much we optimise the baby stroller pages, there are very few tactics that would stop you, in your search for Nike trainers, to abandon the baby strollers and continue your search elsewhere.
The link between CRO and acquisition (be it through PPC or SEO) is paramount to the success of your CvR, and pinpointing where the best quality and most relevant traffic is coming from is a powerful practice that, all too often, gets muddles in communication between those who focus on acquiring customers in the pre-click journey, and those who focus on optimising the post-click journey.
So, once you’ve followed the steps above, you can see where the highest converting traffic is coming from, and re-shuffle your acquisition investments accordingly. Equally, if main sources of traffic are not performing well, this is cause to re-evaluate the messaging and ensure that it aligns with the terminology on the landing page as best as possible.
Once on the report, sorting by transactions is the most insightful option in terms of seeing where the most high-intent traffic comes from.
A strategy that is becoming increasingly popular is to use dynamic landing pages, which dynamically insert terminology from the user’s search into the landing page. (This works best when combined with dynamic search ads).
7. Goal Funnel Visualisations: Conversions → Goals → Funnel Visualisation

Quite simply, this report tells you how many users are dropping off at each stage in the funnel and, therefore, which one you need to investigate and optimise first. Undoubtedly an indispensable insight for CRO.
Summing up
These reports undoubtedly form the basis of planning conversion rate optimisation experiments. While a blanket approach for every client does not exist, begin by exploring these reports for invaluable insights. Data over opinion always rules.
Depending on your business, there are many other GA reports that are tucked away and will highlight the opportunities you need to improve – they’re just waiting for you to find them.