

There are numerous places to start when first analyzing a landing page or website. One of those places is Google Analytics. Analytics allows you to pull useful reports that provide a further analysis of current performance and where to optimize to improve that performance. In this whitepaper, we’ll focus on 13 analytics metrics that will contribute to your conversion rate optimizations.
1. Bounce Rate
The first metric to evaluate on the landing page or website is the bounce rate. The overall bounce rate of the site can tell us how long users are staying on the site before leaving. We can break it down by specific pages to measure bounce rate on each page. Below is an example of how we can measure bounce rates and what they mean for the site.
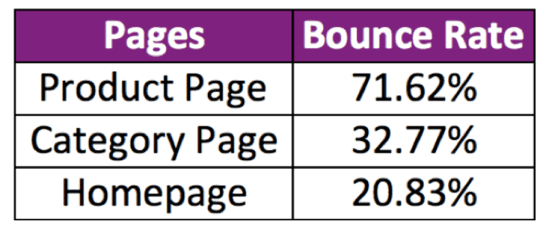
This is just one way to break down bounce rate metrics. We can take away a few key learnings from this data. The product page is an important page on an ecommerce site. The product page is the visitor’s step before adding their specific product to the cart and potentially purchasing. We want to provide enough information for the visitor so they’re able to proceed without leaving.
2. Time on Site
The second metric to pay attention to is the average session duration. This metric gives us an indication of how long our visitors are actually staying on the site and tells us a story. For example, there could be navigational issues if they’re spending too much time on the site. While spending too much time on the site isn’t necessarily a problem, in combination with other user testing findings, the session duration could contribute to a larger story.
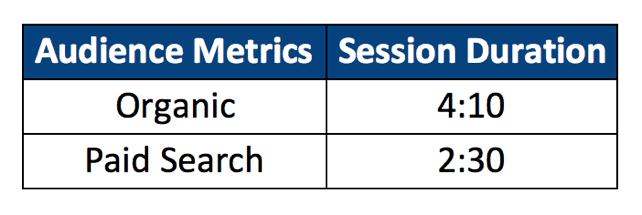
In the example above, we’re able to look at session duration by the type of audience visiting the site. In this example, for our paid search clients, we want to increase the session duration and meet their expectations after visiting the site.
3. Pages per Visit
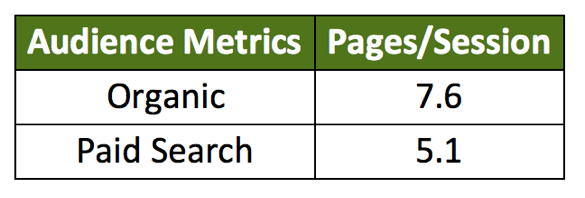
The third metric to analyze is the number of pages per visit. This metric could be easily analyzed in combination with the bounce rate and the average session duration. If the session duration is longer, the user might visit more pages. If the bounce rate is high, the pages per session could be low. We want to make sure that our visitors are navigating the site and finding what they’re looking for. We want to increase our conversion rates and if users aren’t visiting enough pages to either fill out our form or purchase a product, we want to improve the experience.
4. New vs. Returning
The next metric we’ll look into is analyzing our audience types. Breaking the audience down by new vs. returning visitors, we’re able to take a closer look into how audience types impact performance. Below is an example of how we can break down our metrics.
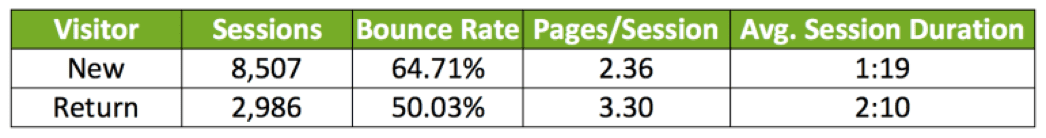
From this data, we can make a few assumptions in our efforts to improve performance. Because a lot of the sessions above are new visitors, we want to optimize performance for this particular audience. Are we not providing enough information on the page in that their bounce rate is higher and their session duration is lower?
For our returning visitors, is there a way we can increase the session duration even more and drop the bounce rate?. Since these visitors are returning, they might already have more brand recognition and wouldn’t need to bounce.
5. Devices
The next report looks at performance by device. Below is a chart combining the above metrics but further broken down by the device used.
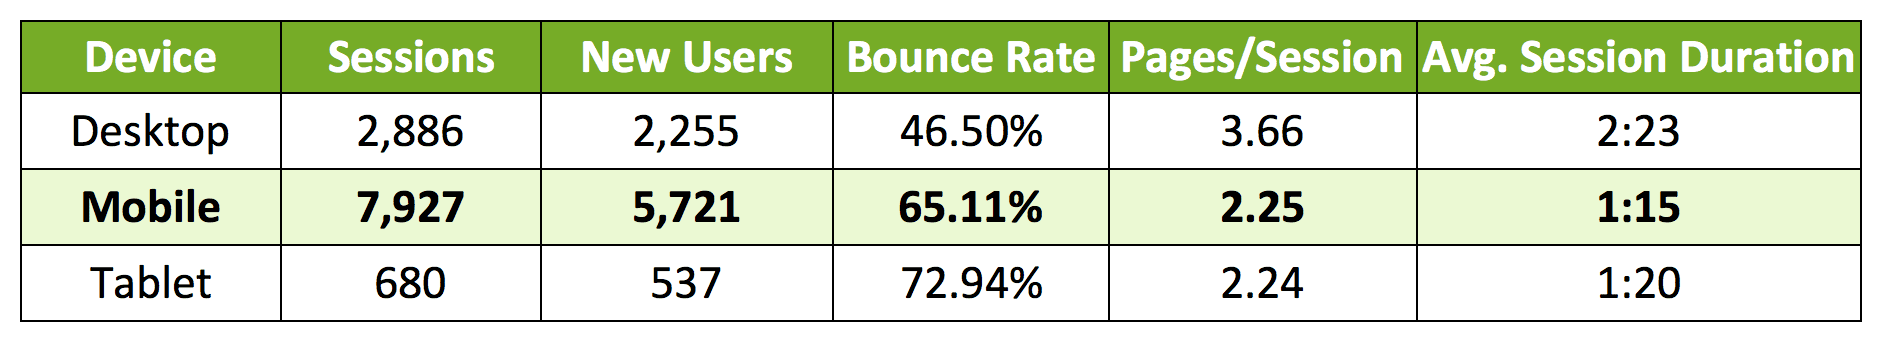
Our key finding is to focus on mobile users. In this specific example, mobile sessions are a lot higher than the other two devices and the metrics are much worse in comparison. Because we have so many mobile users, we can definitely use these metrics to help form a CRO strategy and testing structure. From this device report, mobile would be one of our first recommendations to begin testing to improve the metrics
6. In-Page Analytics
The last Google Analytics tool is In-Page analytics. This tool is an add-on you can use on your pages to measure activity on the page you’re focusing. If you don’t have heatmapping technologies set up on your site, this is a tool to utilize to see where visitors are clicking and what links they’re clicking. We can use this data to see what elements are most important to the visitor and try to optimize around that information.
7. Exit %
When we focus on exit rate, we’re looking at those who visited multiple pages and on their last page, decided to leave the site. If we’re focusing on bounce rate, those visitors arrived at a specific page and left that same page without visiting any other part of the site. This rate becomes especially important if we’re looking at a visitor’s journey through the site. In e-commerce, for example, as the user is going through the checkout process, if the cart page exit rate is high, that means it’s an area to optimize so more visitors are making it past the cart and potentially making purchases.
8. Site Speed
The next metric we’ll focus on is site speed. Studies have found a direct correlation between slower site speed leading to fewer conversions. When we use site speed through Analytics, we can measure by site overall or break it down by specific pages. By breaking it down page by page, we can pinpoint what could be causing the site’s speed metrics to be reduced and focus solely on that page. Below is a breakdown of site speed across multiple pages:
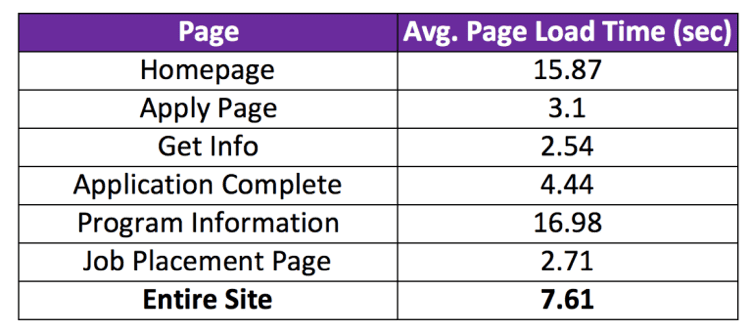
A good rule of thumb is that any page taking over 7 seconds to load could be optimized. Anything below is probably fast enough that it’s not having a direct impact on site functionality and visitor impressions.
9. Goal Funnel (Funnel Visualization)
In the Conversions section of Analytics, if set up properly, we can review our conversion funnels. By looking at the Funnel Visualization below, we’re able to see how many users dropped off from each step, indicating areas of optimization.
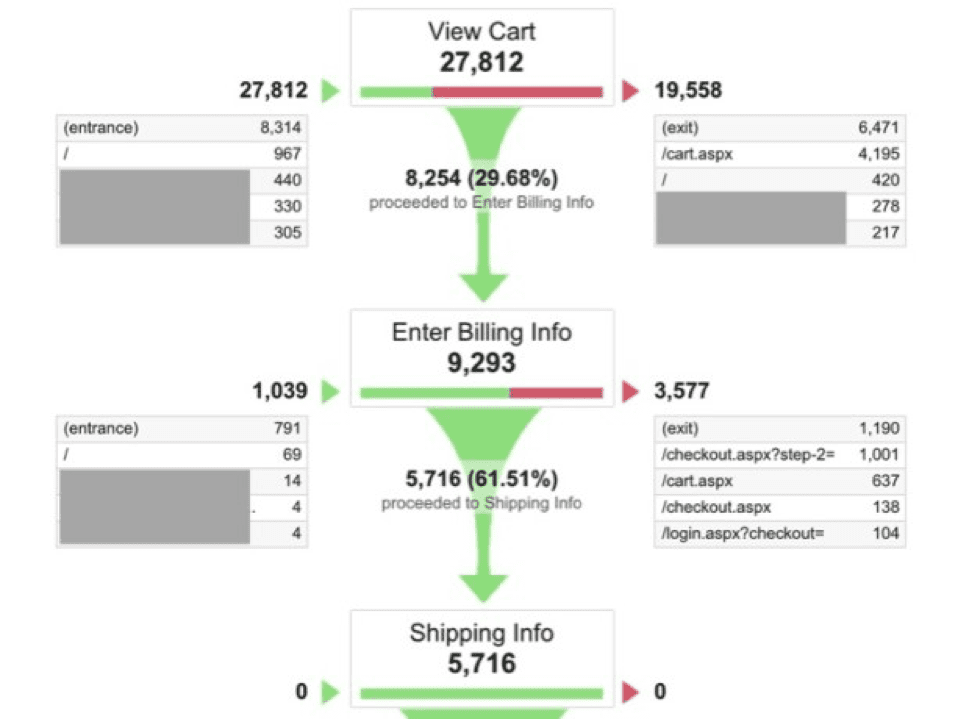
As we can see, it breaks down that we have a significant number of people dropping off after they reach the cart page. Maybe there’s an area for optimization to reduce that drop-off amount.
10. Path length
Under Multi-Channel Funnels, we can use the Path Length tool to measure how users are interacting with our site and how long it’s taking them to convert. Looking at the chart below, we can use path length alongside our remarketing strategy to grab users after they visit.
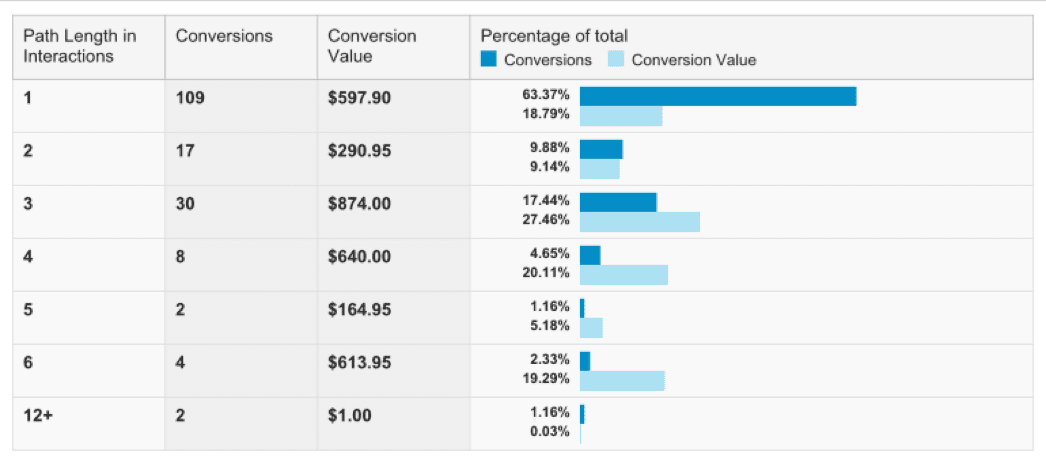
From this information, we are reassured that users are converting after returning to the site. This would be a great opportunity for CRO to create a new landing page experience for these visitors and drive them to convert by creating a more personalized experience.
11. Acquisition
Another tool we can use is the Acquisition Overview section of Analytics. This information could further tell us what types of visitors are converting at a higher rate as well as what other types of visitors aren’t converting at such a rate.
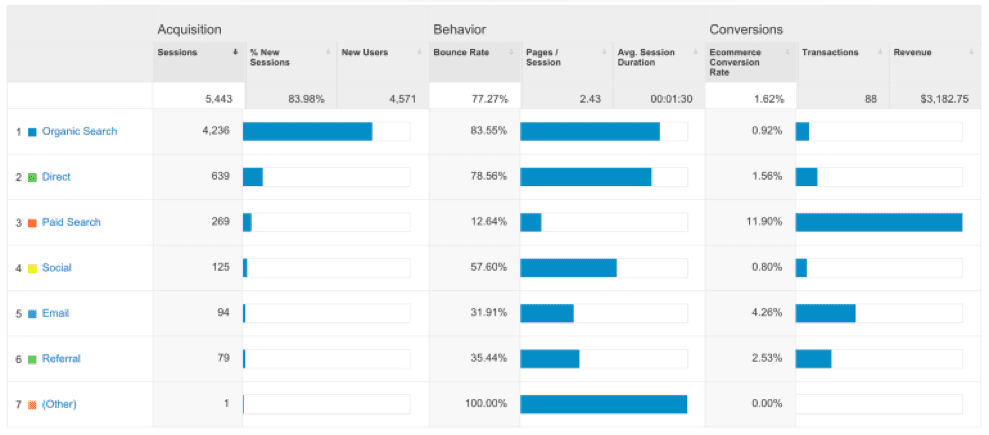
For example, let’s focus on Social. Social bounce rate is one of the higher metrics on this report. This is an area for improvement and where we could focus our CRO testing. By evaluating the separate channels, we can work on creating individual experiences for those users that will improve conversion rate and overall performance.
12. Behavior Flow
Behavior Flow outlines the way users are navigating throughout your website. By looking at this data, we can find the most common paths that users take. As an example, if they’re going from a Program Overview Page to an Insurance Verification Page and finally to a contact form, try to connect those dots and optimize that experience. If it’s widely used by the majority of your website visitors, you can be reassured that most visitors will appreciate the optimizations and ultimately lead to more form fills.
13. Content Experiments
The last Google Analytics tool we’ll be looking at is Google Content Experiments. This tool gives us the option to set up split URL page testing within the Analytics interface. Once we set up our basic parameters, we’re able to view reports like below to analyze performance of the split test.
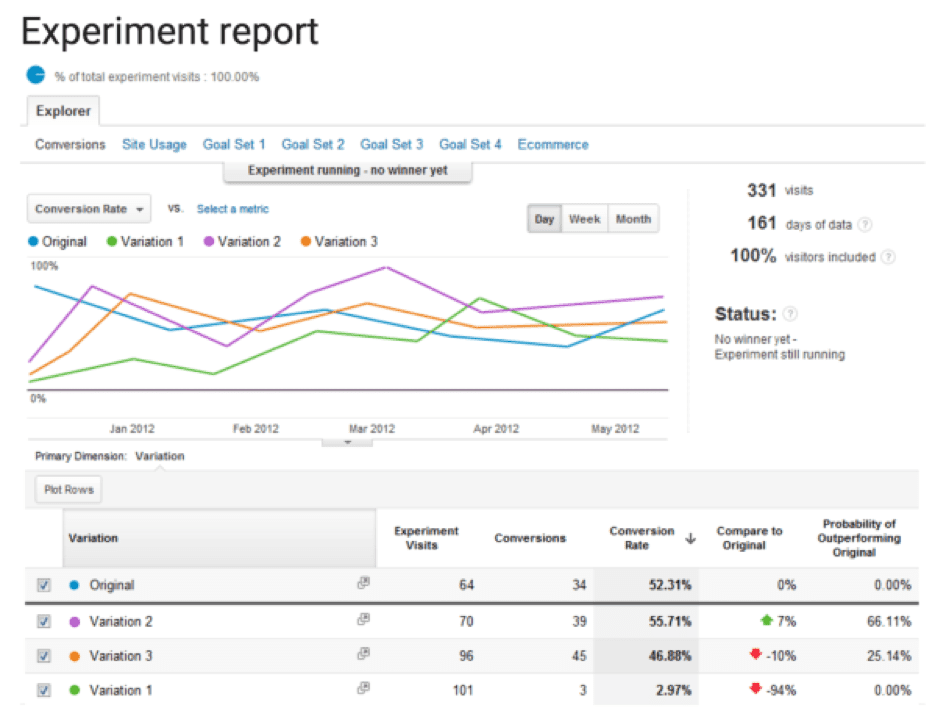
If you have URLs in place or are testing existing pages, you can use the Experiments within Google Analytics to drive your testing.
Final Thoughts
The amount of information within Google Analytics is massive. These 13 metrics are just the beginning of the type of information we can use to further our CRO strategies and techniques. They can provide new meanings to your site performance but can also work together to pick out pain points of the site and by addressing them, you’ll be able to optimize and likely increase performance and conversion rate. I encourage you if you haven’t used Analytics data in the past, to dive into the reports and the various metrics to develop an analysis to increase conversion rate and optimize the user experience.