
Introduction
The past 12 months have been exceptionally unique, presenting businesses and our wider society with unforeseen challenges, as the world continues to reckon with the global Covid-19 pandemic. Similarly, since our last demographic report in June 2020, Brainlabs has experienced phenomenal change. We have welcomed 201 new joiners (6 of whom are in our senior leadership team), acquired and integrated User Conversion (a Manchester-based CRO agency), and expanded to Asia through opening an office in Singapore.
Our top-level diversity, equity and inclusion (DEI) philosophy is that every company should have a workforce that reflects the diversity of the local community at every level (see: Race in the workplace), i.e. each office demography should broadly reflect its wider regional population. Not only is fostering a diverse and inclusive workforce the right thing to do from a moral perspective, but companies that embrace DEI statistically outperform their competitors. Diverse organizations perform better, as they are able to understand varied perspectives, tap into different markets and make better decisions that accurately reflect the society we live in. Improved retention, fresh ideas, a highly collaborative team all lead to better results. Inclusion is crucial: there is little value in building a diverse workforce if marginalized groups feel unwelcome or unable to progress as easily as others. See our company handbook for more details on our stance.
No one has cracked diversity yet; every company can improve. The purpose of sharing this report is to be honest about where we are and where we want to get to. Leadership and culture both play a big role in tackling diversity, equity and inclusion challenges, so we’re going to need your help!
What we’ve achieved since last year
The four clear focus areas listed in our 2020 report were improving our inclusion and representation of genders, ethnicities, disabilities and educational backgrounds, including reducing pay gaps and diversifying our leadership team. Below is a list of initiatives we’ve implemented over the last 12 months, followed by our 2021 demographic results.
Education
- Introduced compulsory unconscious bias training for all employees, delivered by a third-party provider
- Introduced mandatory inclusive leadership training for the senior and People teams, delivered by a third-party provider
- Updated our internal unconscious bias training and incorporated into onboarding
- Built out a wealth of educational resources under the DEI section of our internal wiki
- Around inclusive language, types of bias, allyship, a micro-intervention guide, a glossary of terms and more
- Hosted a series of educational events in line with global celebrations (see: Events)
Culture and policy
- Reduced our mean gender pay gap from 15.8% in our July 2020 report to 7.6% in our 2021 report (see: Pay gaps)
- Added optional demographic questions to employee HR profiles to better understand our demographics throughout the year (as surveys are annual)
- Launched global Employee Resource Groups (ERGs), which act as safe spaces formed around specific shared identities
- Our current groups are: BIPOC, LGBTQIA, caregivers, people with disabilities, Buddhism, Christianity, Hinduism, Islam, Judaism, Sikhism
- These give people a place to share experiences and live their authentic identities without fear of repercussions, judgement or discrimination
- Created gender-transitioning guidelines for trans/gender non-conforming employees, coworkers, HR, and anyone involved in a workplace gender transition
- These cover best practices for employees, managers, and addressing clients
- Implemented gender-neutral parental leave policy that encourages and normalizes all parents taking the same amount of parental leave
- The concepts of maternity and paternity leave reinforce gender roles and stereotypes; they are also heteronormative, as they assume all couples involve a father and mother
- Achieved Level 1 certification within the UK Disability Confident scheme
- This means Brainlabs has committed to accessible employment, reasonable adjustments and support mechanisms for people with disabilities
- Recognised Juneteeth as a paid US holiday (prior to federal recognition)
- Introduced sanctions against perpetrators of discrimination in our staff handbook
- Extended our zero-tolerance policy to online behavior
- Created a dedicated Diversity, Equity and Inclusion budget for events, training, etc.
- This allows us to pay for more speaking engagements
Events
- Celebrated Black History Month
- Dr Jason Chambers led a session about African Americans in Advertising based on his book, Madison Avenue and the Color Line
- Hosted a fireside chat with Chelsea Kwakye and Ọrẹ Ogunbiyi, authors of Taking Up Space, exploring their experiences as Black women at University of Cambridge
- Zephaniah Chukwudum talked to us about Microsoft UK’s DEI journey and how he turned their BAME group into a resounding success (securing rapper Akala as keynote speaker for Juneteenth)
- Partnered with charity Urban Synergy for mentoring opportunities
- Pioneered a global reading initiative, in which we shipped one book from a curated anti-racism reading list to all employees
- Celebrated International Women’s Day
- Hosted inspiring career discussions with Claire Valoti (VP of Snapchat) and Alice Leguay (COO of Clim8), as well as a roundtable with women in Brainlabs’ senior leadership team
- Artist Laxmi Hussain delivered a guided online life-drawing class, exploring the body through self-appreciation and celebrating the female form
- Raised £2,360 for Refuge, which provided a safe night’s stay in a refuge to over 40 women and children
- Raised $1,340 for Girls Who Code, which helped create a world-class curriculum and develop new programs to close the gender gap in tech
- Celebrated Pride Month
- Charity Co-Chair Tash Walker delivered an engaging talk reviewing the Switchboard logbooks, analyzing how the milestones of the LGBTQ+ communities can be traced in calls to the helpline since 1974
- Ben Pechey – writer, speaker, DEI consultant and LGBTQIA advocate – delivered a session exploring pronouns and allyship
- Crayola The Queen delivered a Pride-themed virtual quiz and Q&A session
- Susan Ferentinos PhD provided an overview of LGBTQIA+ past and suggested ways we can learn and engage with LGBTQIA+ stories in our communities
- Raised £2,072 for Human Dignity Trust, a charity working to reform anti-LGBT laws in the 71 countries where LGBT people are still criminalized
Recruitment
- Revamped our end-to-end entry-level interview process
- Removed culture interviews, as these were looking for culture-fit rather than culture-add; interviewers weren’t trained in inclusive interviewing
- Introduced objective testing and scoring rubrics
- Applications are nameless in order to mitigate biases as much as possible
- US anonymised candidate screening takes place via the Career.Place platform: applicants complete an assessment to test out the job, then we evaluate their homework! We do not know the candidate’s name nor see their resume until their homework is reviewed
- UK recruitment now uses a designated application window, rather than recruiting on a rolling basis, so no one is penalised based on timing
- Our UK recruitment team has partnered with Multiverse: from September 2021, ⅓ of all entry-level joiners will be from non-graduate backgrounds
- Our US recruitment team has partnered with COOP Careers, which aims to build a diverse pipeline of college grads overcoming underemployment
- We ask for preferred pronouns in the application and onboarding process
- Built resources and training for inclusive interviewing and unbiased hiring
- Created a DEI section under the careers page on our company website
- This is where we will share the results of annual demographic surveys
- Interweaved our company DEI mission into our values (see: Brainlabs handbook)
- Added optional Equal Opportunity questions to job ads to better understand whether our ads are appealing to a diverse candidate pool
Retention
- Added optional demographic questions to exit interview process to understand whether certain demographics leave Brainlabs at a faster rate than others
- Added exit interview questions relating to diversity and inclusion to gauge where employees feel we are excelling, and where needs more focus
- Revamped promotions process to incorporate demographic checks to make sure all demographics receive promotions and pay rises at an equal rate
DEI team and committees
- Appointed a Global Diversity, Equity and Inclusion Director, responsible for creating one unified, global strategy as we continue to expand internationally
- Appointed US and UK leads to run our regional committees
- Our UK committee has doubled in size, growing from 7 to 15 members
- Our US committee has 21 regular members
- Both are open to all employees keen to attend and voice their perspective
- Launched new sub-committee groups (e.g. events, comms, resources) to provide our committees with more ownership and direction
Leadership
- Signed the CEO Action pledge to commit ourselves to advancing diversity, equity and inclusion in the workplace (N.B. this is a US-centric scheme)
- Created a leadership mentoring scheme so that the senior team is able to connect with more people at different levels across the organization
- Global and regional leadership members sponsored and led various DEI events, introducing speakers and sharing their own experiences
- US regional leaders regularly attend DEI committee meetings
Notes on the 2021 dataset
84% of our Brainlabbers completed our 2021 demographic survey, so the following results represent that group of 340 respondents.
It’s worth noting that our 2020 report was solely UK-focussed, whereas this year we analyzed a wider dataset, including US and APAC employees too. All of the responses collected were anonymous: we will only provide analysis breakdowns where it does not risk making our data identifiable, or where regional data breakdowns are more appropriate.
This report focuses largely upon government protected characteristics: we are using a data-driven approach to benchmark our stats against regional averages, and have referenced reputable sources where available (eg. official government statistics).
June 2021 demographic results
Protected characteristics
Gender

- Our gender split is 47.9% female, 46.8% male; 0.6% genderqueer/genderfluid and 0.3% non-binary
- 0.4% of the UK population identifies as non-binary; there are currently no robust studies to indicate the size of the non-binary population across the US
- 17% of global leadership is female (1 out of 6)
- 83% of UK leadership is female (5 out of 6)
- 33% of US leadership is female (2 out of 6)
- 0.6% of respondents are transgender
What we’re doing
We want to make sure people from marginalized gender identities are represented and feel a sense of belonging at Brainlabs (i.e. women, non-binary and transgender people), particularly in positions of seniority.
- We perform gender pay gap checks within the performance review process to ensure that promotion rates are equal across gender identities
- We include pronouns fields within Slack and job applications to normalize discussion around identity and be better allies to trans and gender non-conforming communities
- We promote our women’s network WiSDM, aiming to empower women in marketing and give them a voice in the digital industry
- We will challenge our senior hire recruitment process so we can ensure that our recruitment process is objective and data-driven (see more: Recruitment)
Ethnicity

- Please note that the official government ethnicity groupings in the UK and US are different (see: UK list of ethnic groups and US list of ethnic groups)
- Our 2022 report will likely provide more granular regional ethnicity breakdowns as our APAC presence continues to grow
- For the purposes of this report, we have aggregated our global results into 5 groups: Asian, Black, Hispanic, Mixed and White
- The original survey included all official UK and US ethnicity groupings; no respondents selected American Indian/Alaska Native, Native Hawaiian/Other Pacific Islander or Arab ethnicities
- We are under-indexing with <1% Black representation (US average: 13.4%; UK average: 3.3%)
- 89% of our UK employees are based in London, where the local Black population is significantly higher at 13.3%
- 73% of respondents are white, which is broadly in line with regional averages (US average: 76.3%; UK average: 86%)
- However, it’s worth noting that white representation in London is significantly lower at 59.8% (89% of our UK employees are based out of our London office)
- Our 9.4% Asian and 3.5% Mixed ethnicity representation is also roughly in line with UK and US national averages:
- When segmenting this regionally, our US data shows that we have 17.2% Hispanic representation, which is roughly in line with the US national average of 18.5%
- Please note that the 6.2% Hispanic representation shown in the graph above is global data; Hispanic is not an official ethnicity category for the UK
- 25% of individuals responsible for planning, directing and running a region are BIPOC
What we’re doing
We still have work to increase BIPOC representation (particularly Black representation) at all levels, and make sure these individuals feel welcome and included at Brainlabs.
- We are diversifying our recruitment strategy to attract more BIPOC candidates
- Introduced diversity interview targets to make sure we are interviewing an ethnically-diverse pool of candidates (see: Rooney Rule, NB. this is not a hiring quota)
- We are partnering with WYK, Multiverse, COOP careers and Merit America to attract a wider pool of candidates, with a particular focus on ethnic diversity
- We have added a statement to US job ads expressing that we actively encourage applications from BIPOC candidates
- We perform regular inclusion surveys to work out how to tackle issues relating to BIPOC employee satisfaction and retention
- We promote our BIPOC Employee Resource Group within company and new joiners
Sexual orientation

- 13.2% of respondents identified as part of the LGBTQIA+ community
- This is an increase from last year’s report, which was at 11%
- This is above regional LGBT demographics (US average: 4.5%; UK average: 2.0%)
- It’s worth noting that these demographic studies only represent a subsection of the LGBTQIA+ group (namely lesbian, gay, bisexual and transgender representation), so it’s difficult for us to benchmark our demographics with more precision
What we’re doing
We will continue to show up and make ourselves visible as an LGBTQIA-friendly employer.
- We celebrate events such as Pride, Bi Visibility day, Ace Awareness, etc
- We promote gender-transitioning support guidelines, available to all employees
- We promote LGBTQIA+ Employee Resource Group within company and new joiners
- We include pronouns fields within Slack and job applications to normalize discussion around identity and be better allies to trans and gender non-conforming communities
Disability

- 7.5% of respondents have a disability (US average: 26%; UK average: 19%)
- Although this is a 2.5% increase since our UK demographic survey last year, it is still below national averages
What we’re doing
We still have more work to attract and retain employees with both visible and invisible disabilities, and commit ourselves to becoming a more disability-friendly workplace.
- We fulfil our commitments as a Disability Confident employer, including:
- Ensuring our recruitment process is inclusive and accessible
- Anticipating and providing reasonable adjustments as required
- Supporting existing employees who acquire a disability or long-term health condition to stay in work
- We continuously solicit feedback on our flexible working policy to ensure everyone is able to develop a working pattern that suits their needs and ability
- We offer private healthcare to UK- and US-based employees such that any long-term care requirements are accommodated
Age
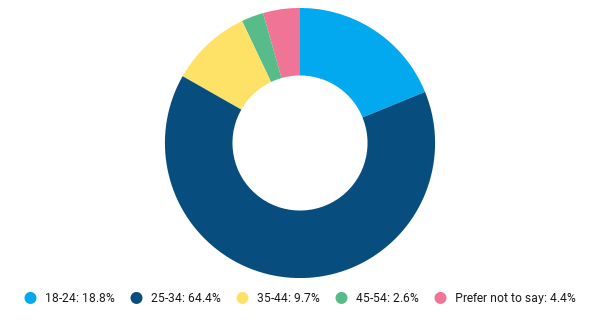
- The majority (64.4%) of respondents fall into the 25-34 age bracket
- The current average age at Brainlabs is 29
- This follows from last year’s report, where the average age was 28
- Campaign states the average age in the marketing industry is 32
What we’re doing
We have been shifting away from exclusively hiring graduates, and in the direction of experienced hires in order to better serve our clients as industry experts.
- We now offer more perks and benefits that cater to a wider range of ages, from generous paid parental leave to private healthcare and flexible caregiver policies (see: Caring responsibilities)
- We will add a question around industry experience in next year’s annual survey to benchmark average the Brainlabber experience level against the wider sector
- We will continue to survey inclusion scores for all ages, as our focus on bringing in entry-level industry talent may impact the sense of inclusion of older demographics
Religion

- 31.2% of respondents affiliate with a religion, which is a slight increase from last year’s statistic of 29.4%
- It’s worth noting that our 2020 report did not include US data and fewer UK respondents affiliated with a religion compared with US respondents: two thirds of UK respondents selected no religion, compared with less than a third in the US
- Brainlabs has more irreligious employees than national averages (US average: 24%; UK average: 25.1%)
What we’re doing
We want to make sure people who affiliate with any religion are represented and feel welcome, included and that their needs are accommodated.
- We recognize and celebrate religious events in our annual inclusivity calendar, so that Brainlabbers can learn about these throughout the year
- We will create office quiet spaces for religious practices and prayer, where possible
- N.B. This has already been done in our London headquarters
- We promote our religious holiday policy so that individuals can swap bank holidays for a different religious holiday
- We promote religious Employee Resource Groups within company and new joiners
Further metrics
Nationality

- We have seen an increase in fully remote workers since the beginning of the Covid-19 pandemic, with >50% of our US employees due to be permanently remote
- We have also branched into APAC by opening an office in Singapore, enabling us to attract more people around the world and diversify the nationalities we represent
- N.B. This is a new data point in our 2021 survey, so we cannot accurately compare this against how many nationalities we represented in 2020
What we’re doing
We want to make sure that we include all nationalities, and that people working from any location feel as included as those who are able to work in one of our offices.
- We will continue our remote set-up for all business updates, live-streaming monthly Town Halls and quarterly All Hands meetings so everyone can be involved
- We updated our tone of voice guidelines to remove Britishisms and Americanisms (e.g. avoiding idioms and phrases that do not translate well across languages)
- We will continue to pay for home-working equipment for remote work
- We encourage virtual tea breaks, stand-ups and catch-ups so folks can keep in contact and retain a sense of community in spite of physical distance
- N.B. Currently we are unable to sponsor visas due to lack of resources, which may hamper our efforts to diversify nationalities. We may reconsider this approach as we continue to grow
Education

- 28.5% of respondents are privately educated, which is high compared to national averages (US average: 10.8%; UK average: 6.5%)
- 24.1% of respondents were the first to attend college/university in their families
- 2.4% of respondents did not attend college/university
What we’re doing
Education is not a government protected characteristic, but committing ourselves to diversity of education will positively impact other aspects of diversity.
- We removed unnecessary education requirements from job ads and only asking for qualifications when it is a legal or regulatory requirement (eg. a legal counsel role)
Mental health

- Roughly 20% of adults in the US and 25% in the UK experience mental illness
- Our respondents reported slightly higher than national averages
- It’s difficult to know how accurate MH statistics are, due to stigma and the non-visible nature of some conditions
What we’re doing
We have made a concerted effort to destigmatize conversations around mental health and will continue to do so.
- We have MH champions who provide care for those that need it, when they need it:
- 6 members of staff are trained as mental health first aiders
- Monthly MH newsletter, featuring an employee Q&A
- Training to all new joiners, as well as manager-specific MH training
- Regular events encourage conversation around wellbeing
- We have a MH Slack channel, where you can request contact from Mental Health First Aiders, read advice and insights into how to prioritize your own MH
- We are part of the EAP (Employee Assistance Program), a 24/7 confidential advice service which offers support for all sorts of matters including health & legal advice, debt management, and bereavement support
- We encourage using sick days for both mental and physical health
- We encourage individuals to use our wellness subsidy for mental health too
- We provide free therapy via our company healthcare plans
Caring responsibilities

- Within the survey, we classified carers as anyone who looks after a relative, partner or friend who cannot cope without their support (e.g. due to illness/disability)
- Over the course of the Covid-19 pandemic, the number of caregivers has risen (US average: 21.3%, UK average: 12.5%)
- Our statistic has increased to 8.8% from last year’s report at 0.6%
What we’re doing
- We added a caregiving default Slack status to normalize conversation around having caring and allow people to easily block out times of day when they’re uncontactable
- We offer flexible working so people can fit work comfortable around their lives
- We give caregivers 5 additional days of paid emergency leave in the UK
- We give unlimited paid time off to attend caregiver-related appointments in the US
- We offer part-time working where possible
Pay gaps
In this section, we have calculated both the mean and median pay gaps for gender and ethnicity. Mean pay gaps are calculated by working out the difference between the mean salary for each group (see: Making your pay gap calculations).
Median pay gaps are calculated by sorting each demographic group from highest to lowest paid, identifying the middle salary, and working out the difference between those salaries (see: Making your pay gap calculations). Median pay gaps do not control for variables such as years’ experience, so it provides a picture of the differences in salaries in an absolute sense.
Gender
Based on the annual salaries given by respondents, our mean gender pay gap is 7.6%. This has more than halved since our report last July, where our pay gap stood at 15.8%. This change is largely due to improving our representation of women in regional senior leadership roles. Our median gender pay gap is smaller, at 1.2%.
Ethnicity
We have chosen to calculate our ethnicity pay gap as white versus BIPOC ethnicities. Each BIPOC ethnicity’s sample size is small, which makes it difficult to draw informative conclusions from our dataset. We understand that aggregating BIPOC into one group is reductive, as each ethnicity is unique, but we have done this to make sure data is not identifiable and to make our results more meaningful.
Our mean and median ethnicity pay gaps are larger, at 21.1% and 23.7%, respectively. We have concluded that this is due to lack of BIPOC representation in positions of seniority and having greater ethnic diversity in junior positions, which, in combination, raises our overall pay gap statistic.
What we’re doing
We can’t fix these overnight, but transparency with our numbers is the first step to closing these pay gaps. It’s also important to mention that while diversifying our entry-level recruitment pipeline (where the majority of our new hires come through) will improve our demographics and make us more reflective of the local population, it will also negatively impact our pay gaps, as senior positions with higher salaries are less readily available.
- We have implemented a more data-driven promotions process to mitigate biases when issuing pay rises, ensuring all demographics are able to progress equally
- We are performing analysis on retention, particularly of BIPOC groups
- We will continue to collect EEOC data throughout senior hiring to ensure we are not favoring candidates with a certain demographic background
Inclusion
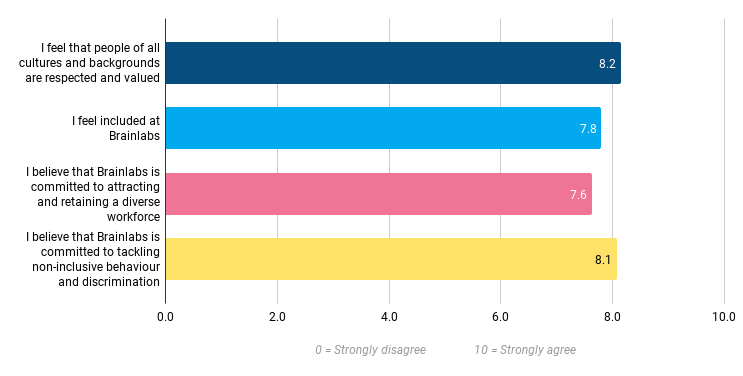
Our DEI inclusion scores for 2021 have improved since our 2020 survey. In this section, employees were asked to score various statements on a scale from 1 to 10. Please note that we have not performed a direct question-by-question comparison, as our survey wording has been slightly altered since 2020. We received an average score of 8.2 out of 10 for “I believe people of all cultures and backgrounds being respected and valued at Brainlabs”, and 8.1 for “I believe we are committed to tackling non-inclusive behavior and discrimination”.
We haven’t provided full breakdowns of these inclusion scores by marginalized groups, as this would run the risk of results becoming identifiable. Men and women scored equally on feeling included at Brainlabs; the biggest disparity was found comparing the score of those living with a MH condition (7.5) versus those without one (8.1). The difference in average inclusion scores within other demographic groups was negligible.
Last year, we received a 6.1 score for “I believe Brainlabs is committed to attracting and retaining a diverse workforce”. This statistic has jumped up to 7.6 (a 22% increase), but there is still room for improvement. It’s important to recognize that as we continue to grow as a business, we must ensure that we continue to score highly on inclusion metrics: there is little value in diversifying our workforce if those individuals feel unwelcome and excluded.
Upcoming focuses
As well as the actions listed throughout this report, here are some of our upcoming focuses. Some of these have carried over from our 2020 report where we still need to double down on our efforts, whereas others are new focuses we have identified over the course of 2021.
Recruitment
- Flesh out the DEI section of our website to spotlight our aims, current projects and how we are continuing to show up as a DEI-forward agency
- Formalize UK culture interview process for senior hires, taking learnings from US
- Hire our next generation of paid interns in the US
- Continue to flesh out our unbiased hiring resources with a recruitment champions tool-kit, which will include tips for everyone to learn how to recruit inclusively
- Roll out UK recruitment partnership with Multiverse: from September 2021, ⅓ of all entry-level joiners will be from non-graduate backgrounds
- Foster partnerships with organizations that help aspiring digital marketers of diverse backgrounds to bridge the skills gap (e.g. hosting a Brainlabs Career Event with COOP Careers)
Retention
- Analyze historic retention based on demographic information provided by leavers
- As these are optional questions, we need to ensure our dataset is robust enough to perform meaningful analysis
- Investigate specific challenges of those with marginalized identities via anonymous surveys sent to Employee Resource Groups
Culture and policy
- Focus on increased inclusivity training to ensure all employees can bring their whole selves to work, diving into microaggressions, vulnerability and anti-racist praxis
- Explore rigorous certification programs to ensure we are remarkable in this area according to DEI standards and best practices
- Continue to celebrate events and run awareness campaigns to normalize conversations about our differences
Conclusion
We’ve made a lot of progress over the last 12 months, which we can take pride in as a business. However, now isn’t a time to rest on our laurels; long-lasting change doesn’t happen instantaneously and requires continuous work. As per the results of this report, our mission over the next year is to improve diversity of ethnicity, gender, disability and educational backgrounds and continue to measure (and respond to) inclusion scores.
This report was compiled in June 2021 by our Global Diversity & Inclusion Director, Leyla Omar
Glossary
- BIPOC: Black, Indigenous & people of color
- DEI: Diversity, equity & inclusion
- LGBTQIA: Lesbian, gay, bisexual, transgender, queer, intersex, asexual
- MH: Mental health
- UBT: Unconscious bias training